
Graph Settings
Overview
This section explains how to create graphs, edit graphs, delete graphs and re-order graph list.
Prerequisites
Before proceeding, ensure the following requirements are met.
-
You have access to iCreate.
-
You are logged in to iCreate.
-
A shipyard has been created.
-
A vessel has been created.
-
Vessel’s Project Status is 'Editing'.
-
You are on the OPS Settings page.
Procedure
1. Open Graphs
From the System Settings sidebar navigation menu, select Graphs.
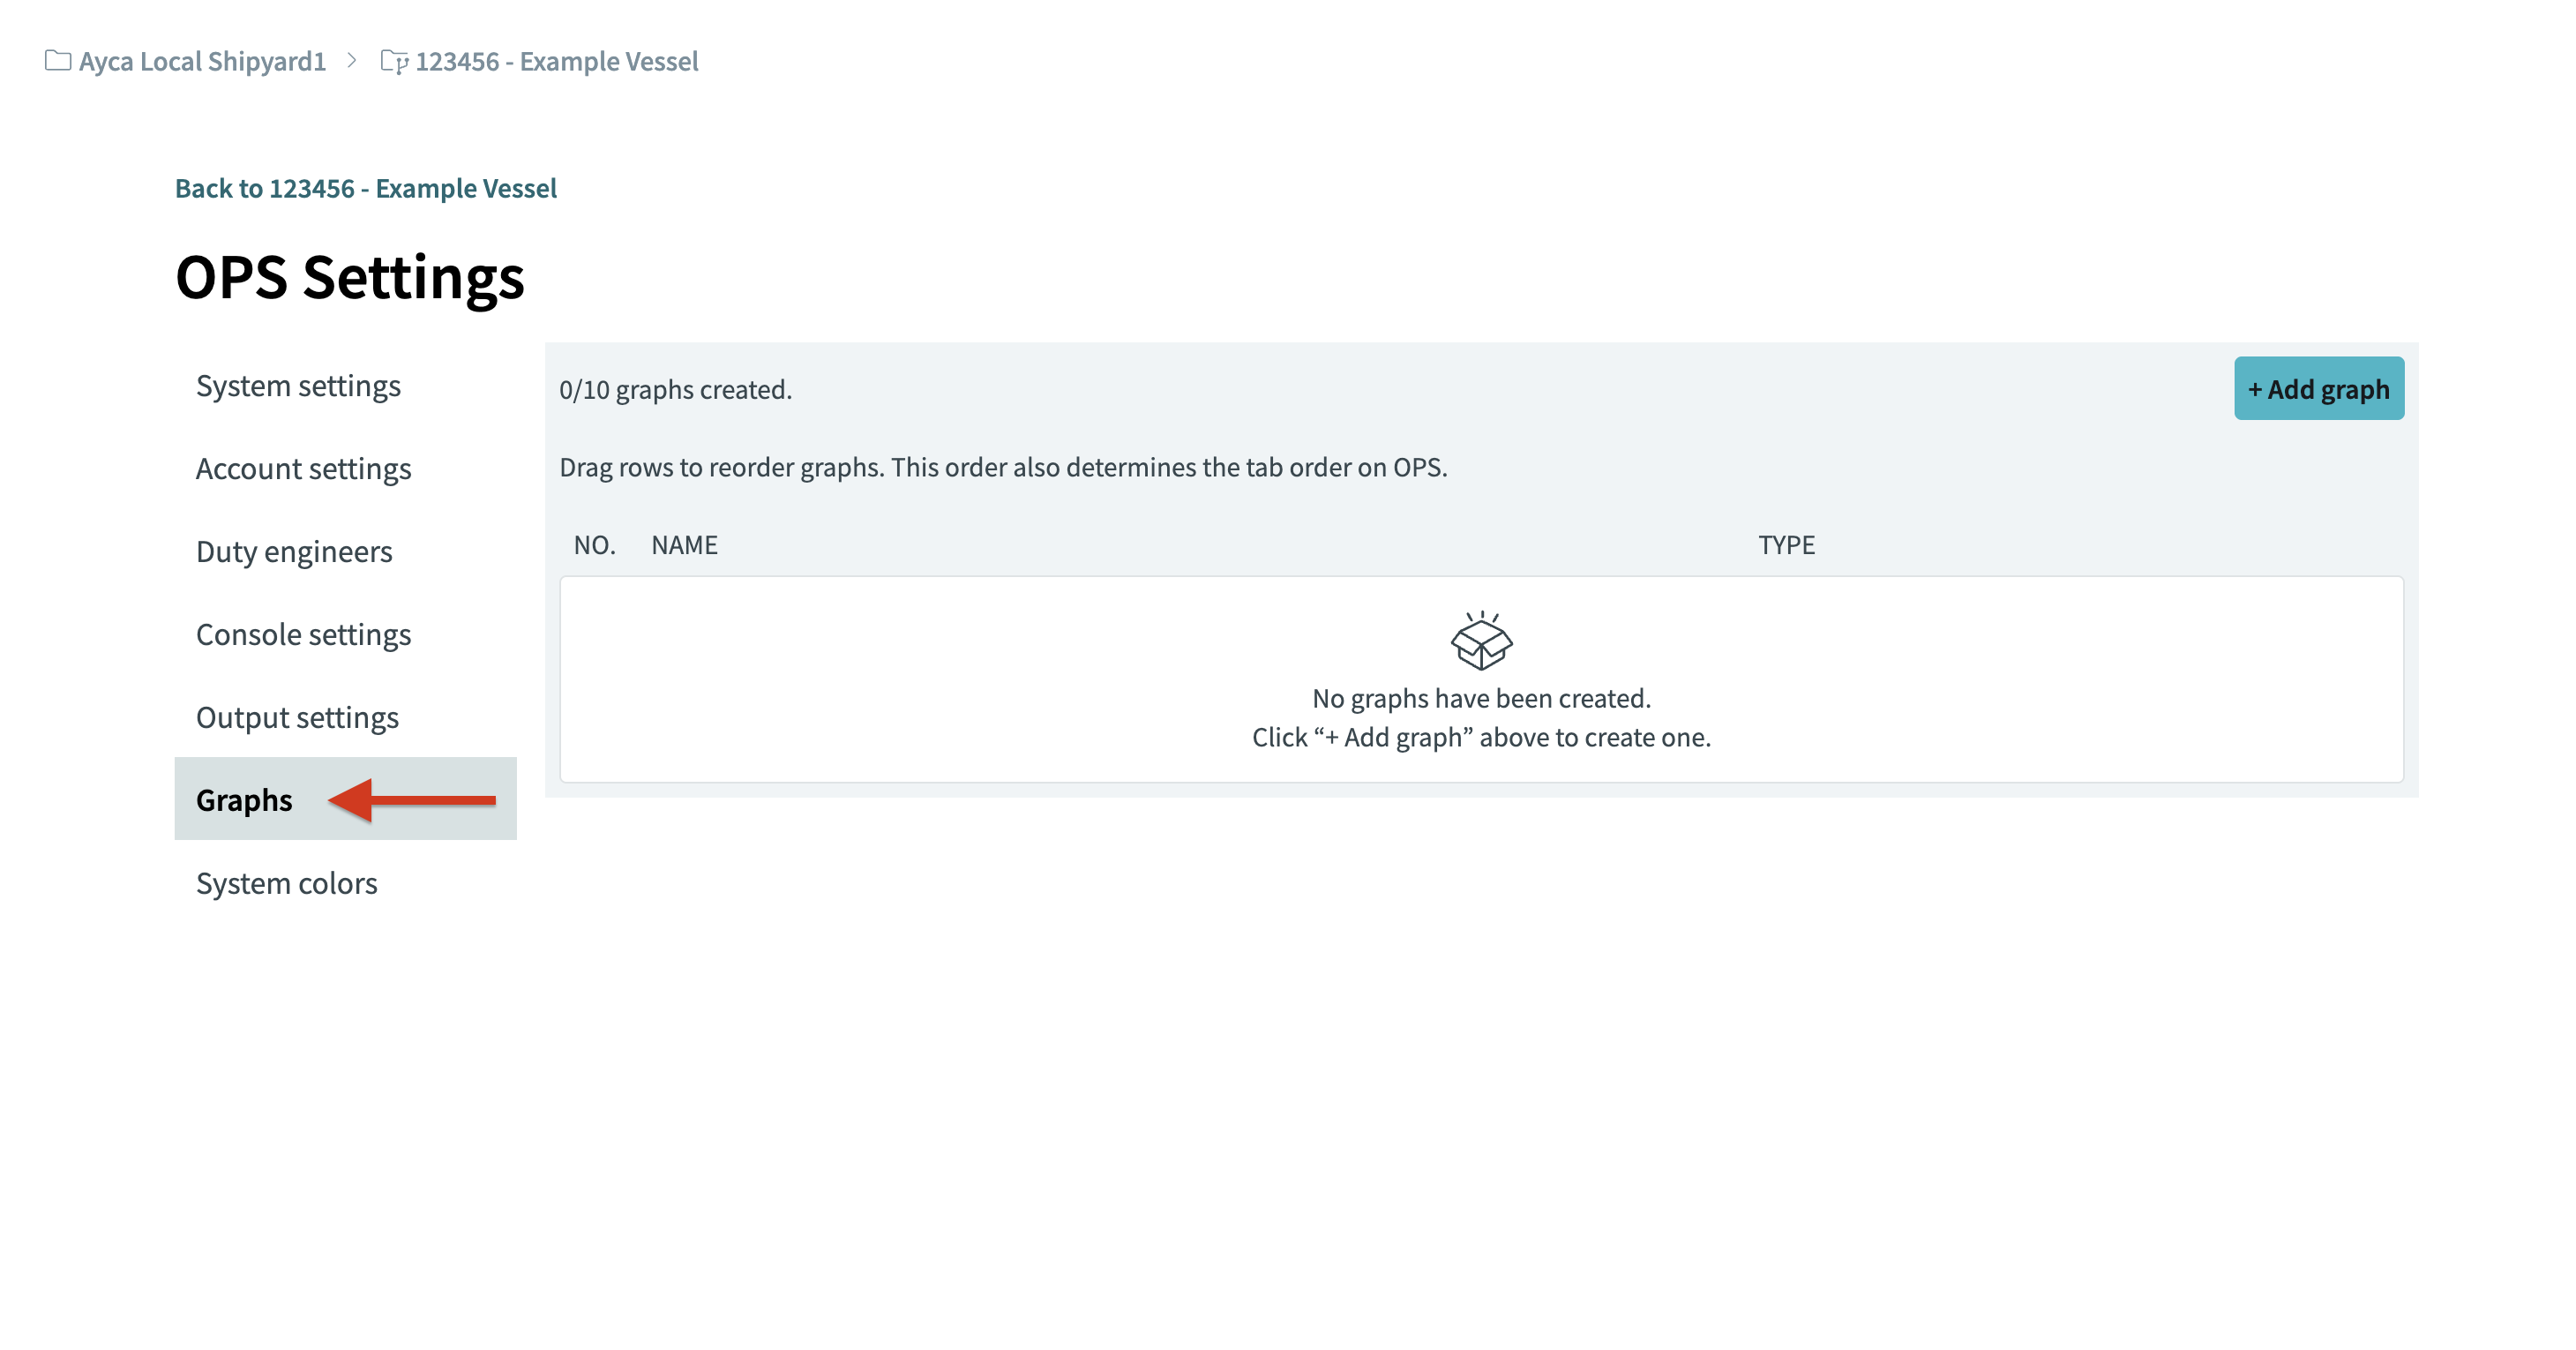
The Graphs page is displayed.
2. Create a Graph
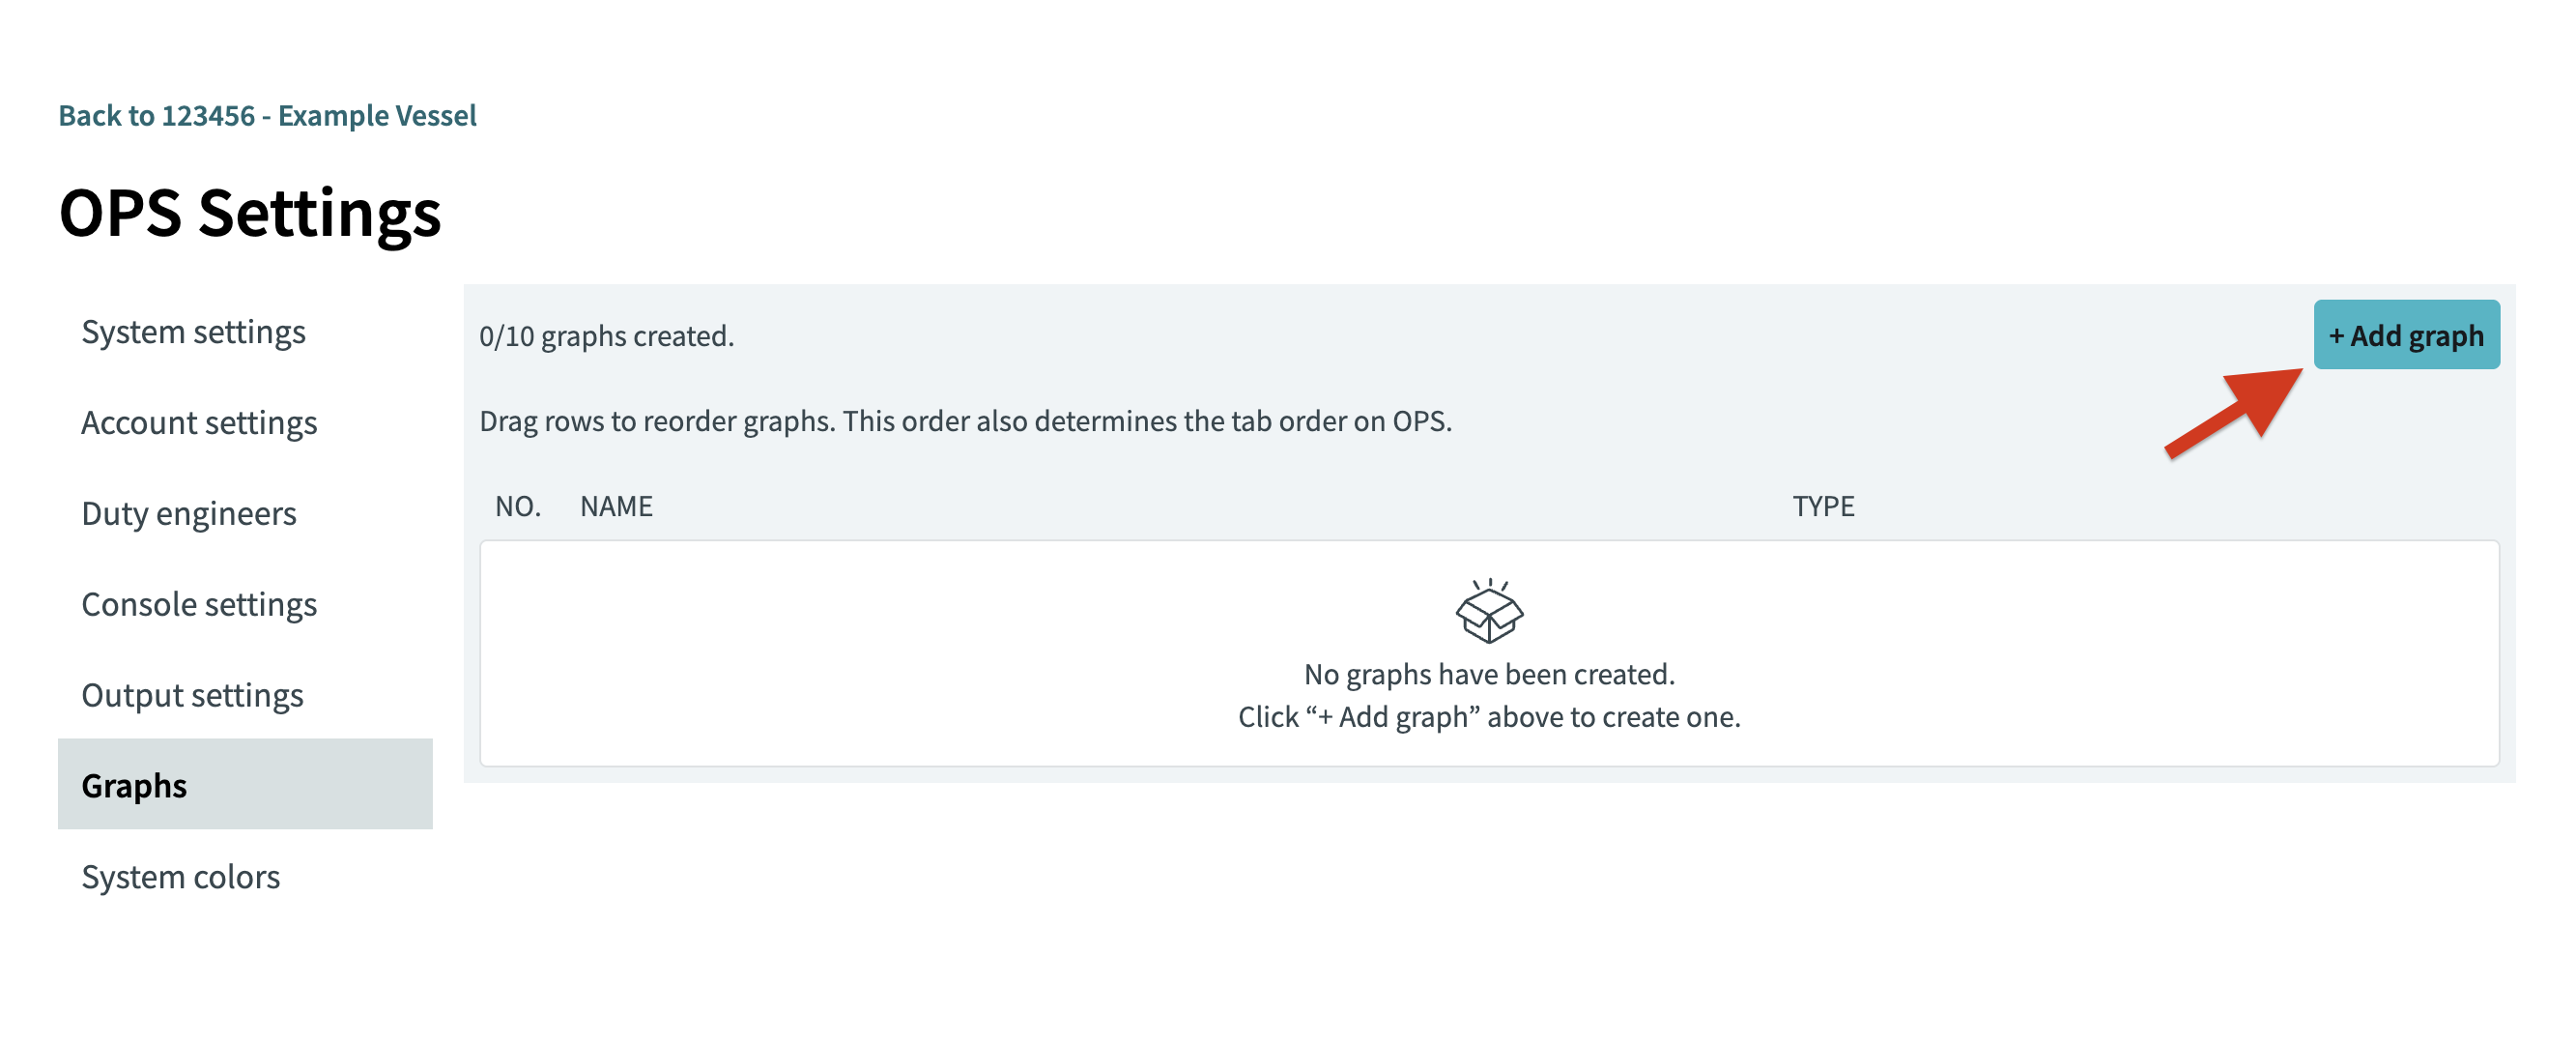
Click Add graph.
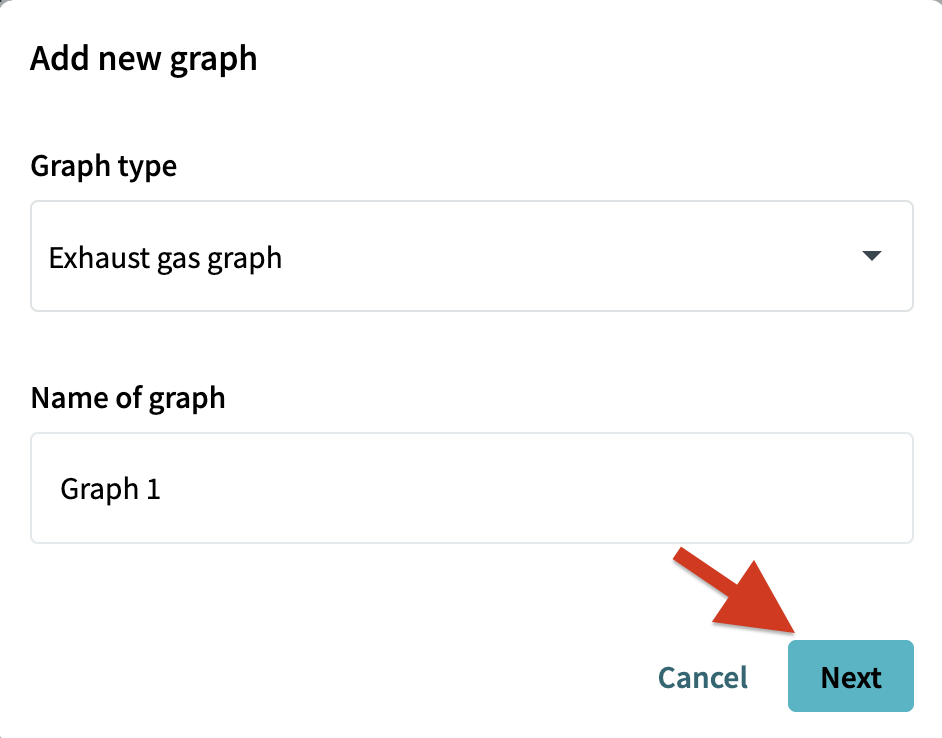
"Add new graph" dialog opens up.
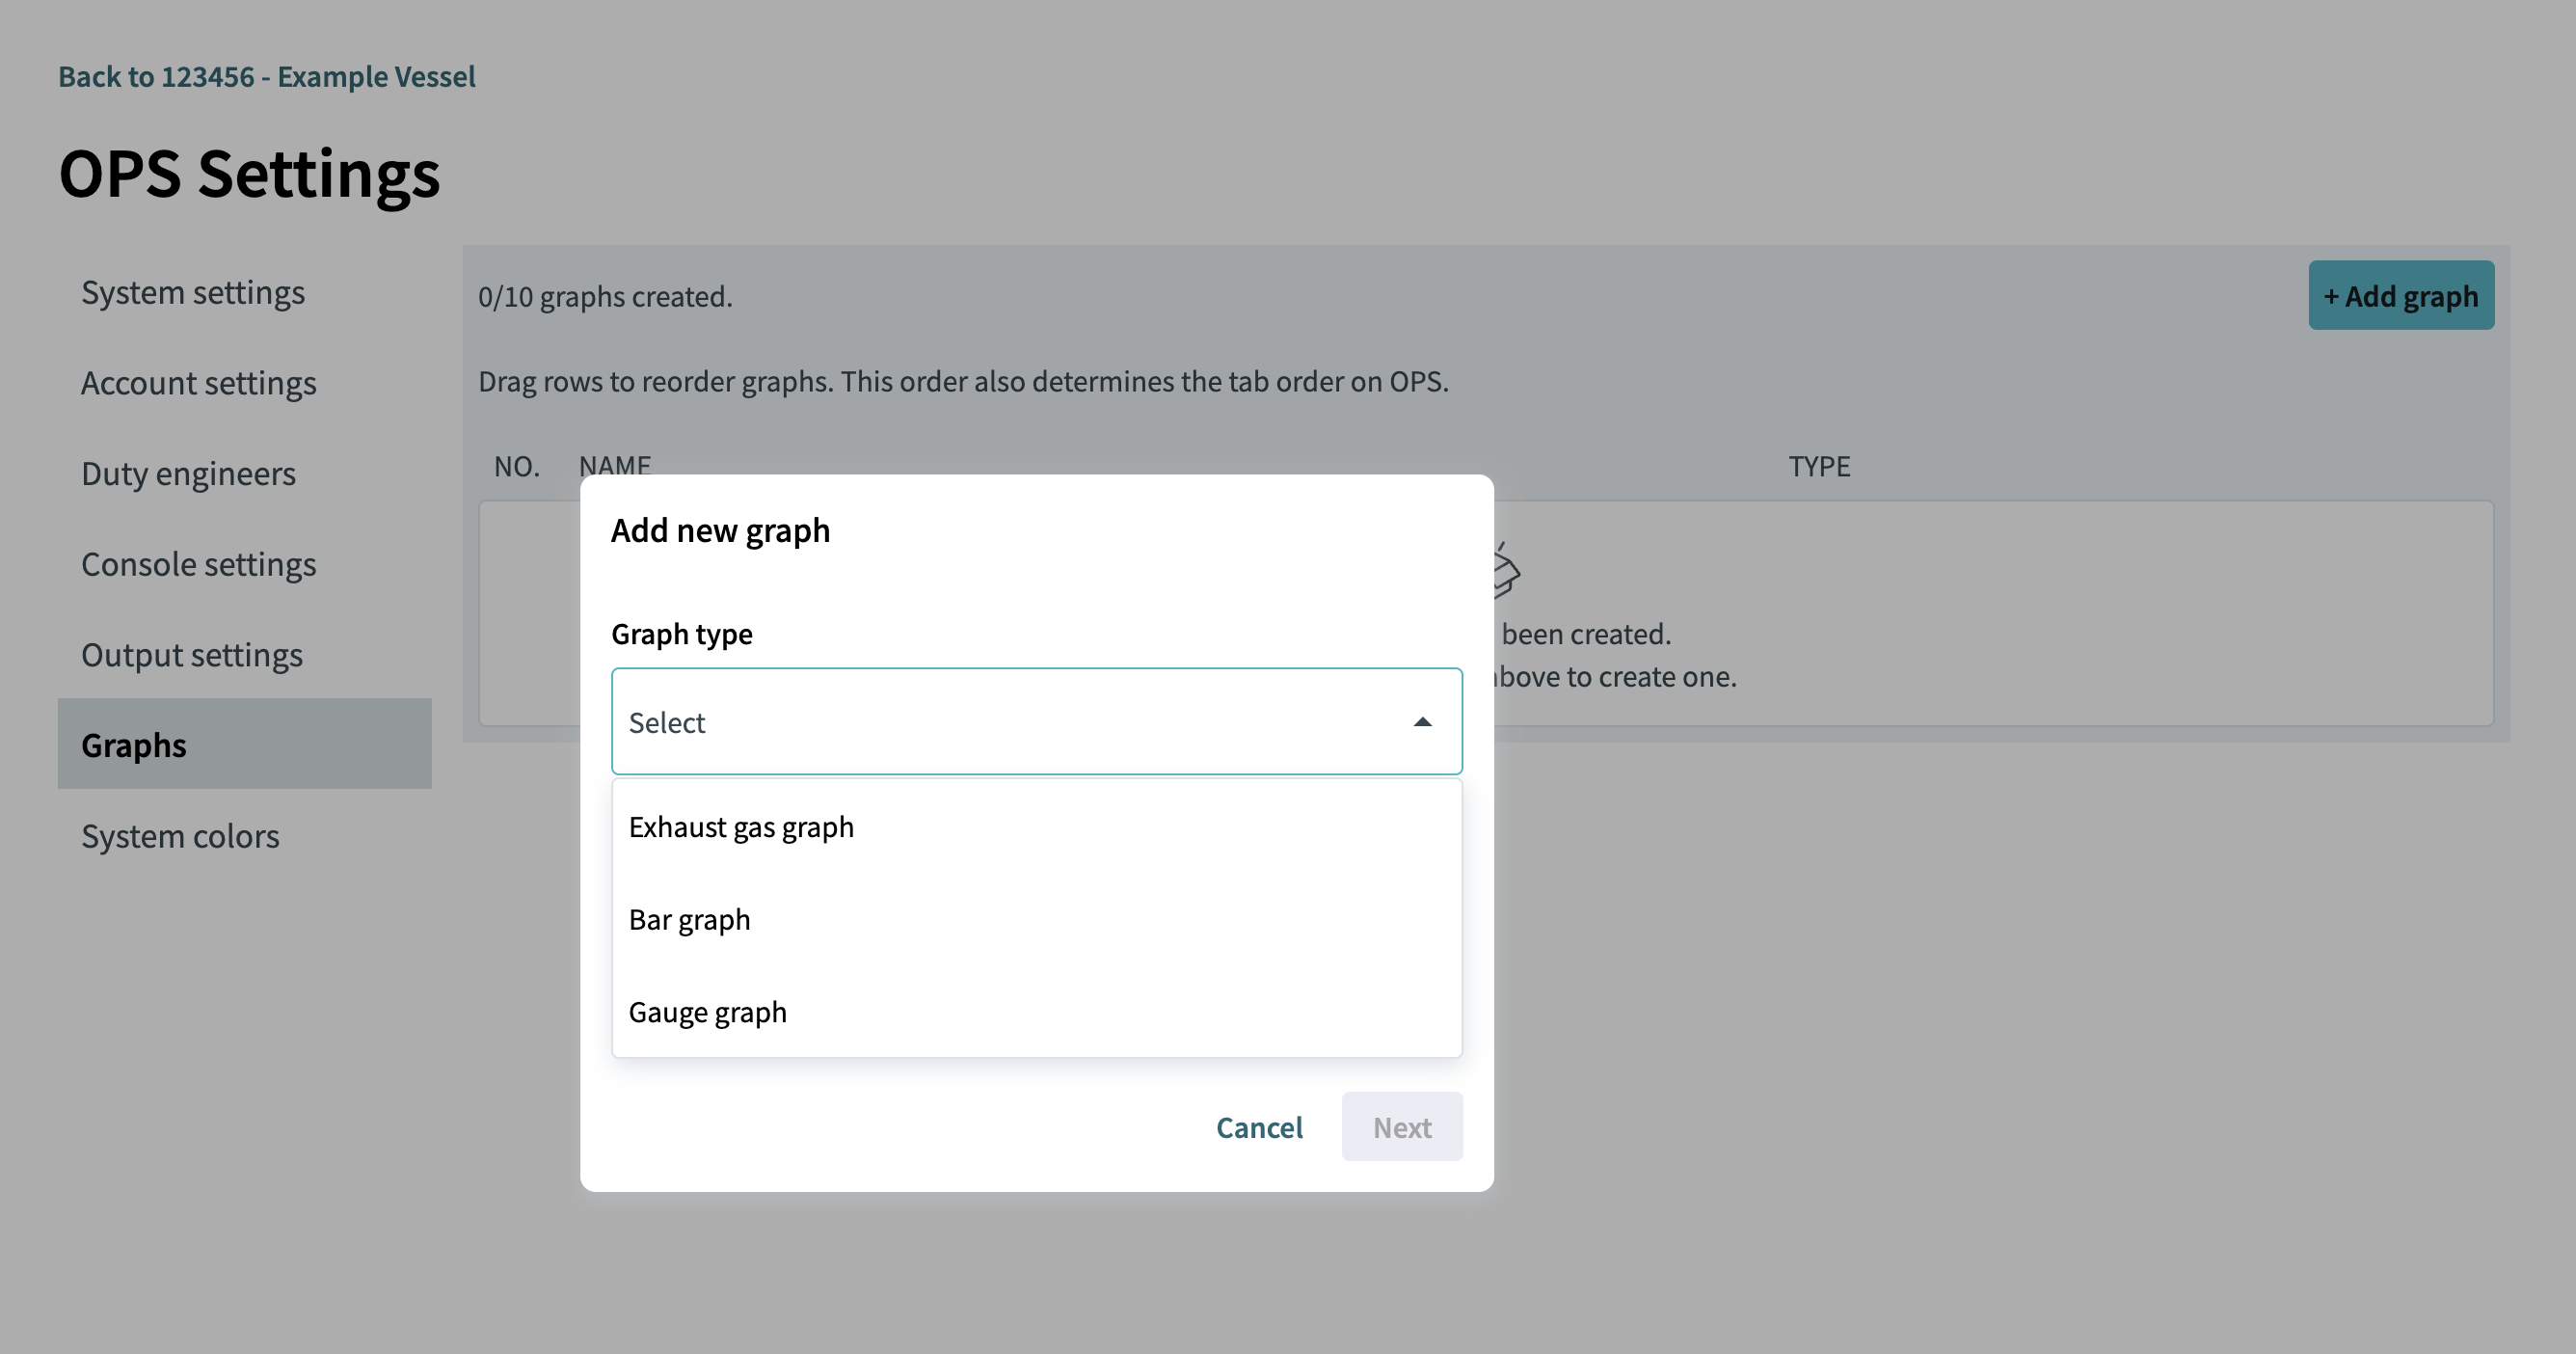
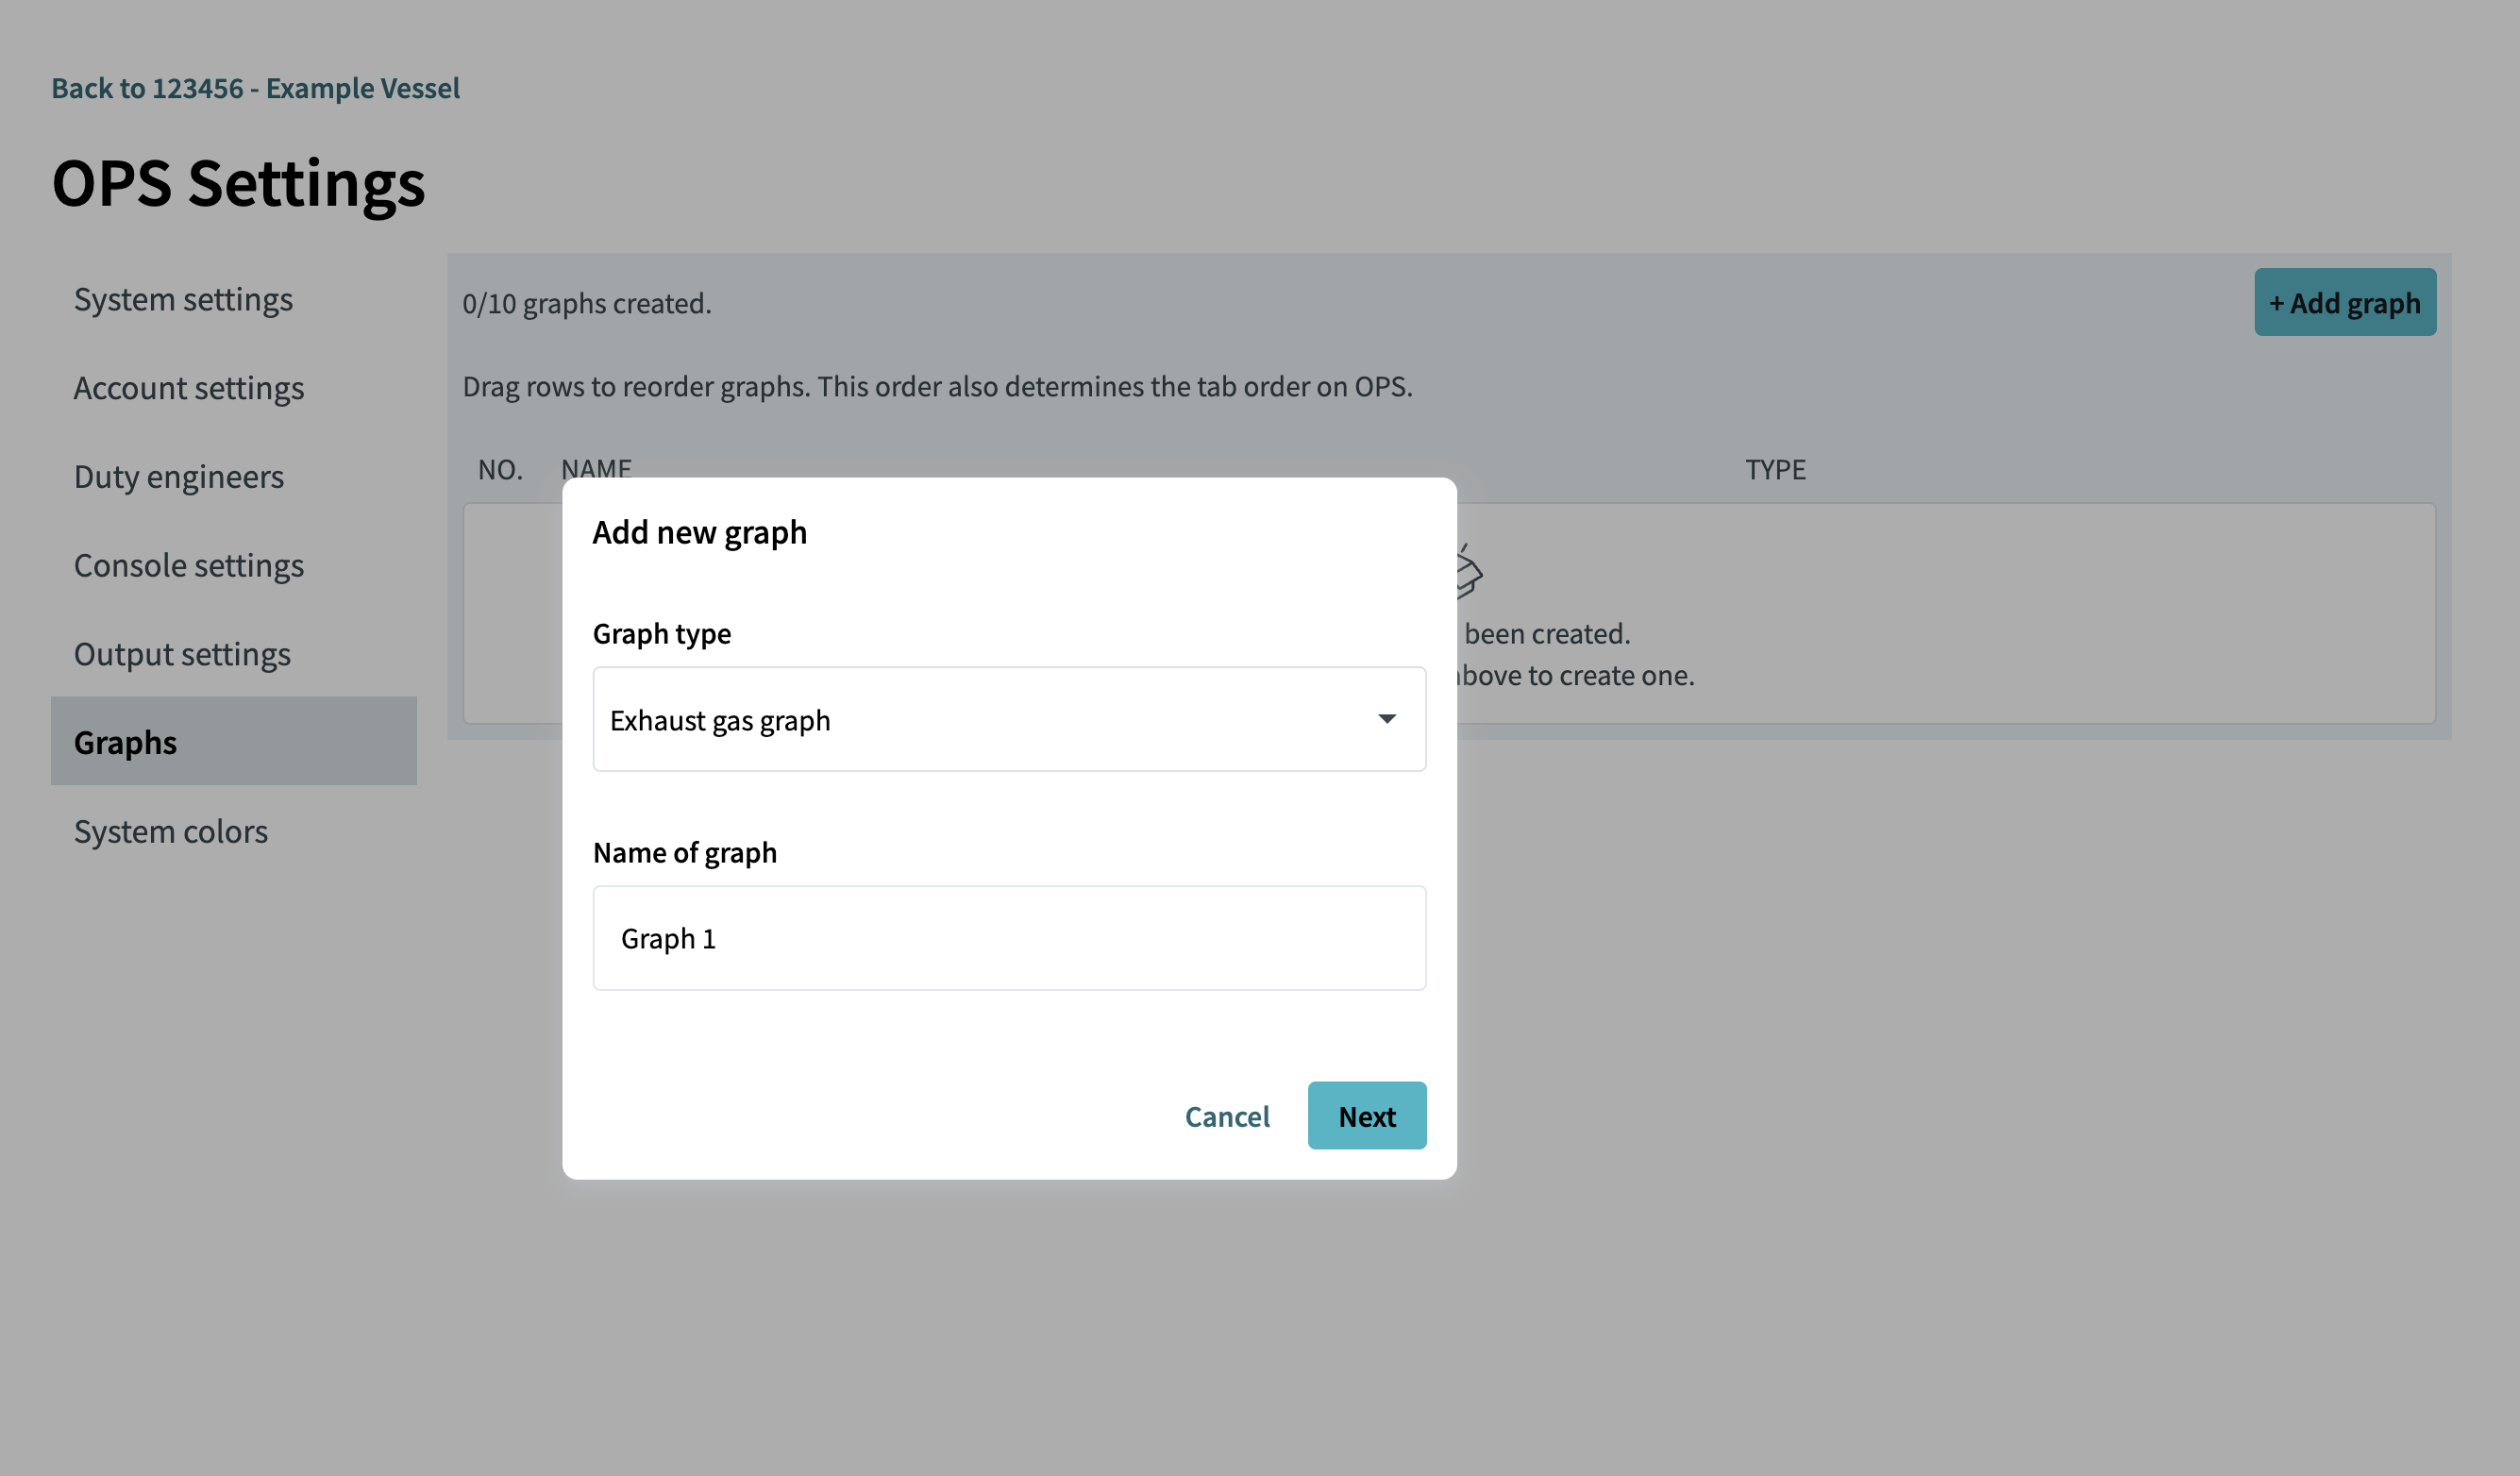
Select the "Graph type" and enter a "Name" for the new graph.
|
The graph name must meet the following requirements:
|
Click Next.
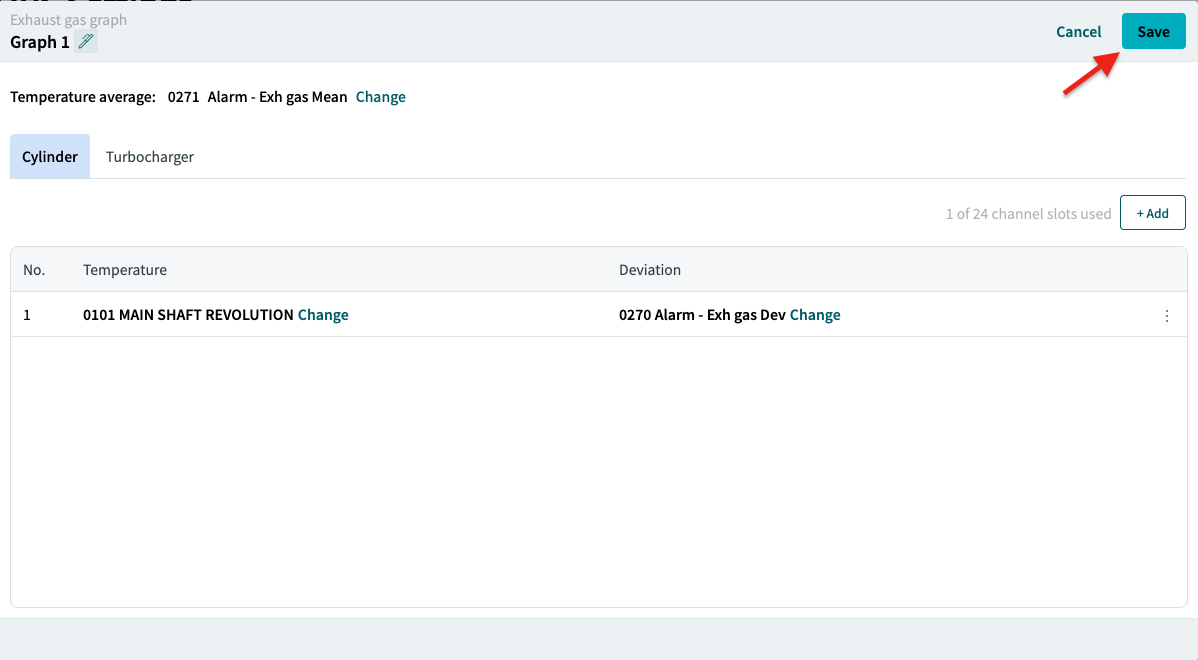
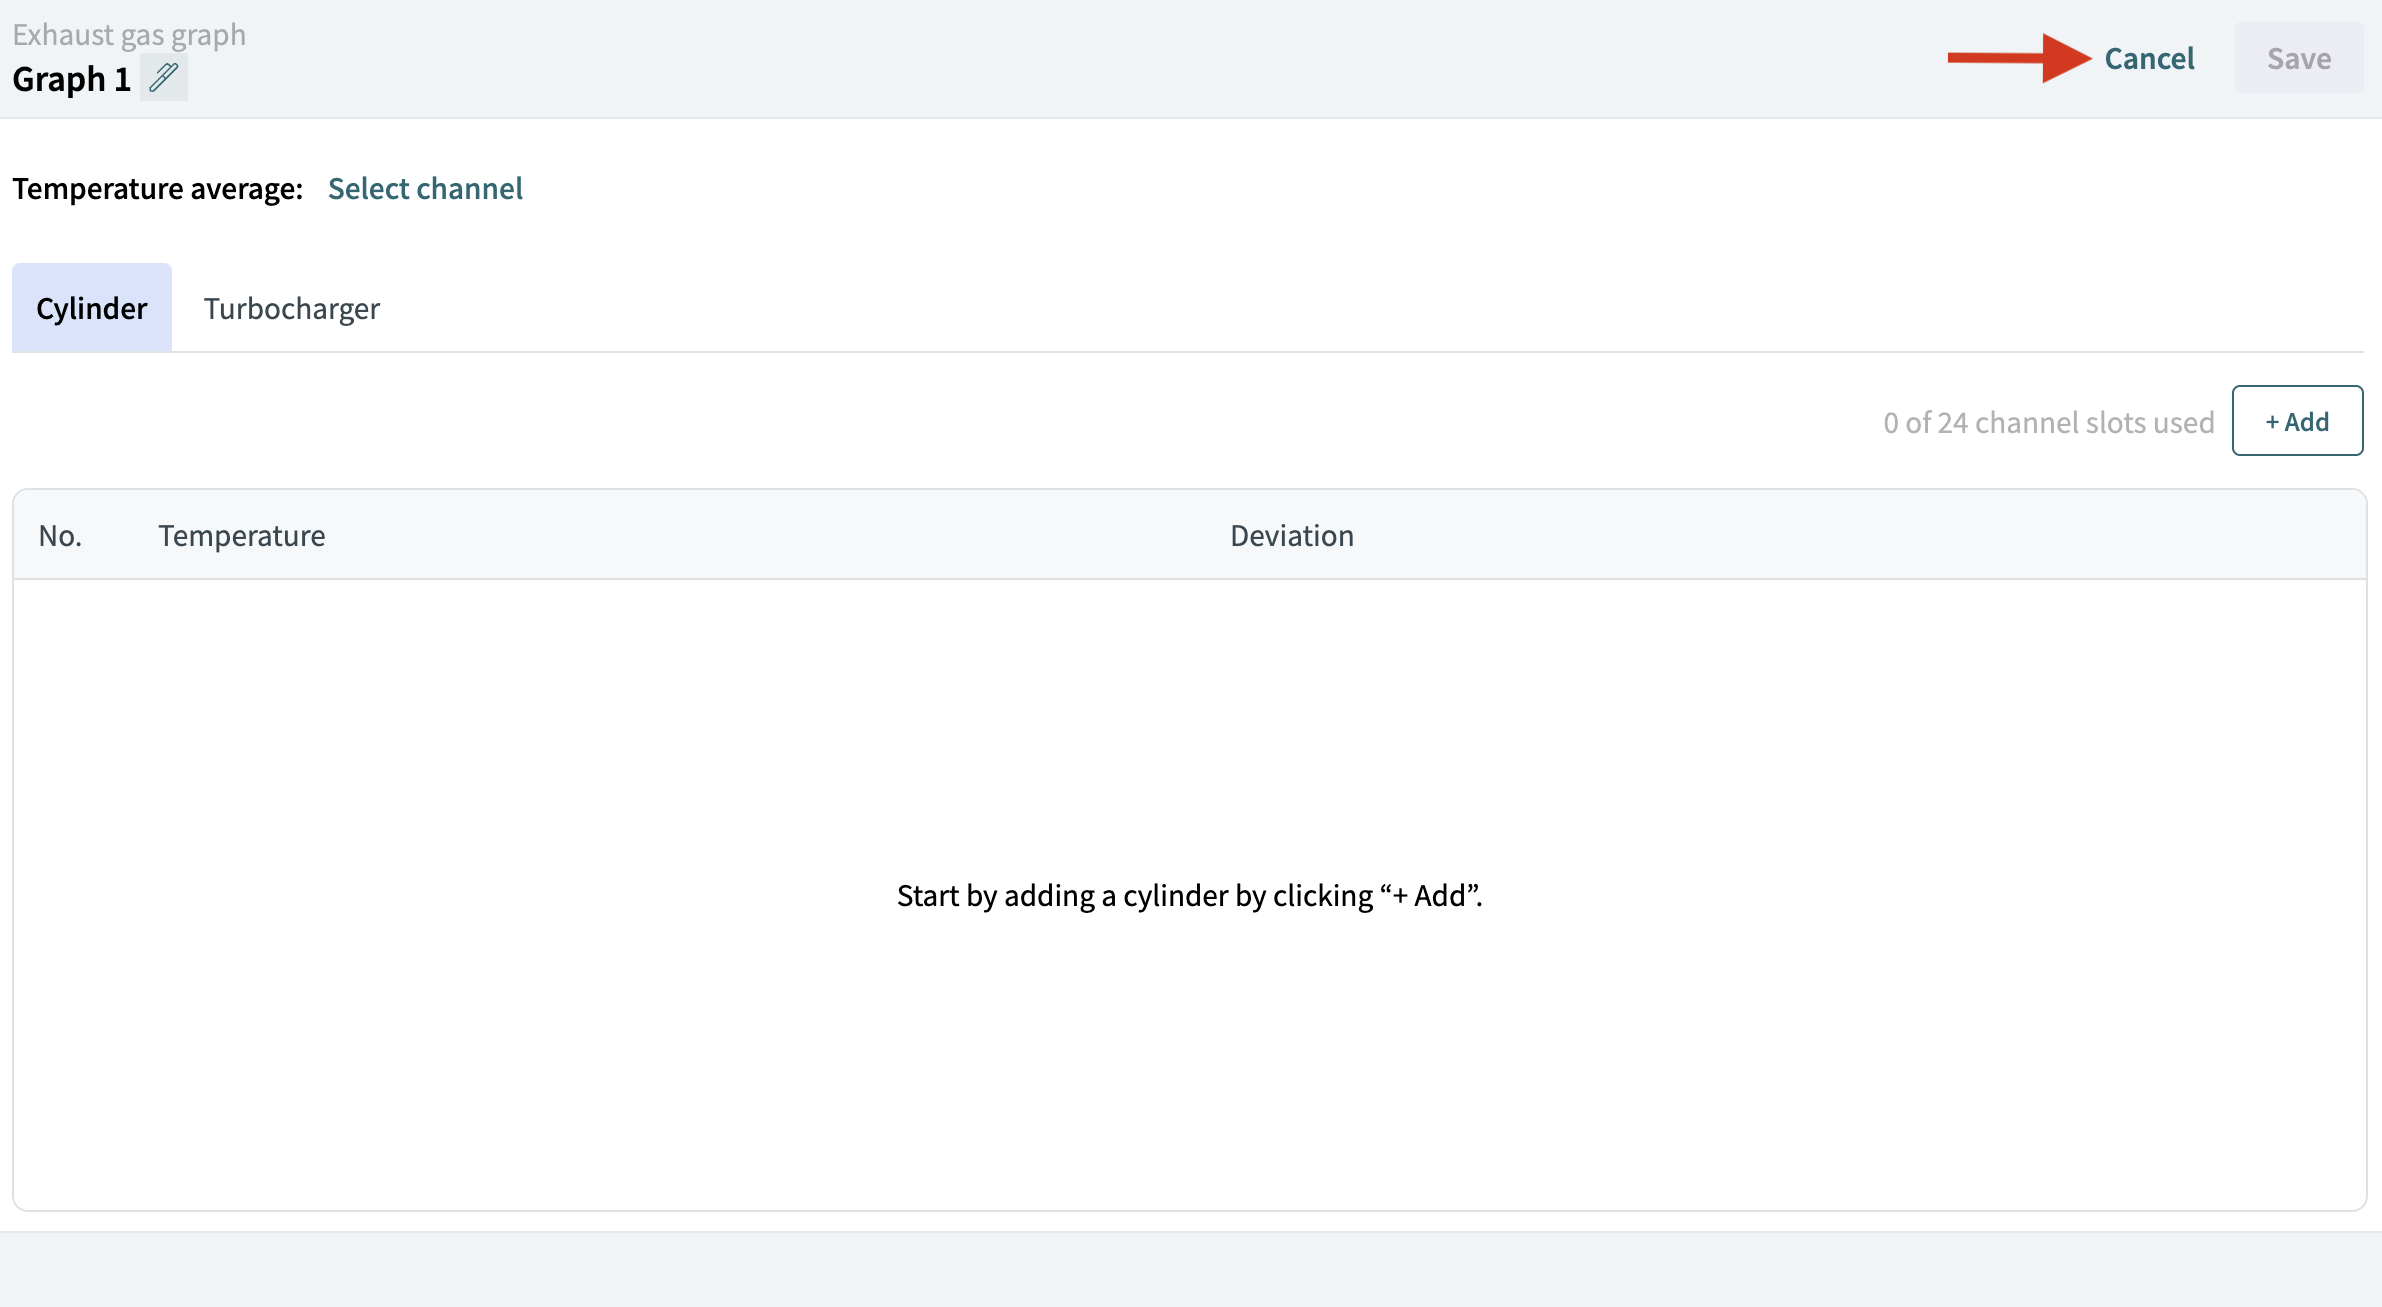
A new window opens with additional graph settings. Depending on the selected graph type, you can set channels for the graph and other graph-specific settings.

The graph is already created at this point. You can either configure additional settings or continue without making any changes.
To configure additional settings, make the required changes and click Save.
|
The Save button is enabled only when changes have been made to the graph settings or the graph name. |
To continue without configuring additional settings, click Cancel.
The "Exit graph settings?" confirmation dialog is displayed with the following message:
"The graph has already been created. Exiting now will keep the graph without any additional settings."
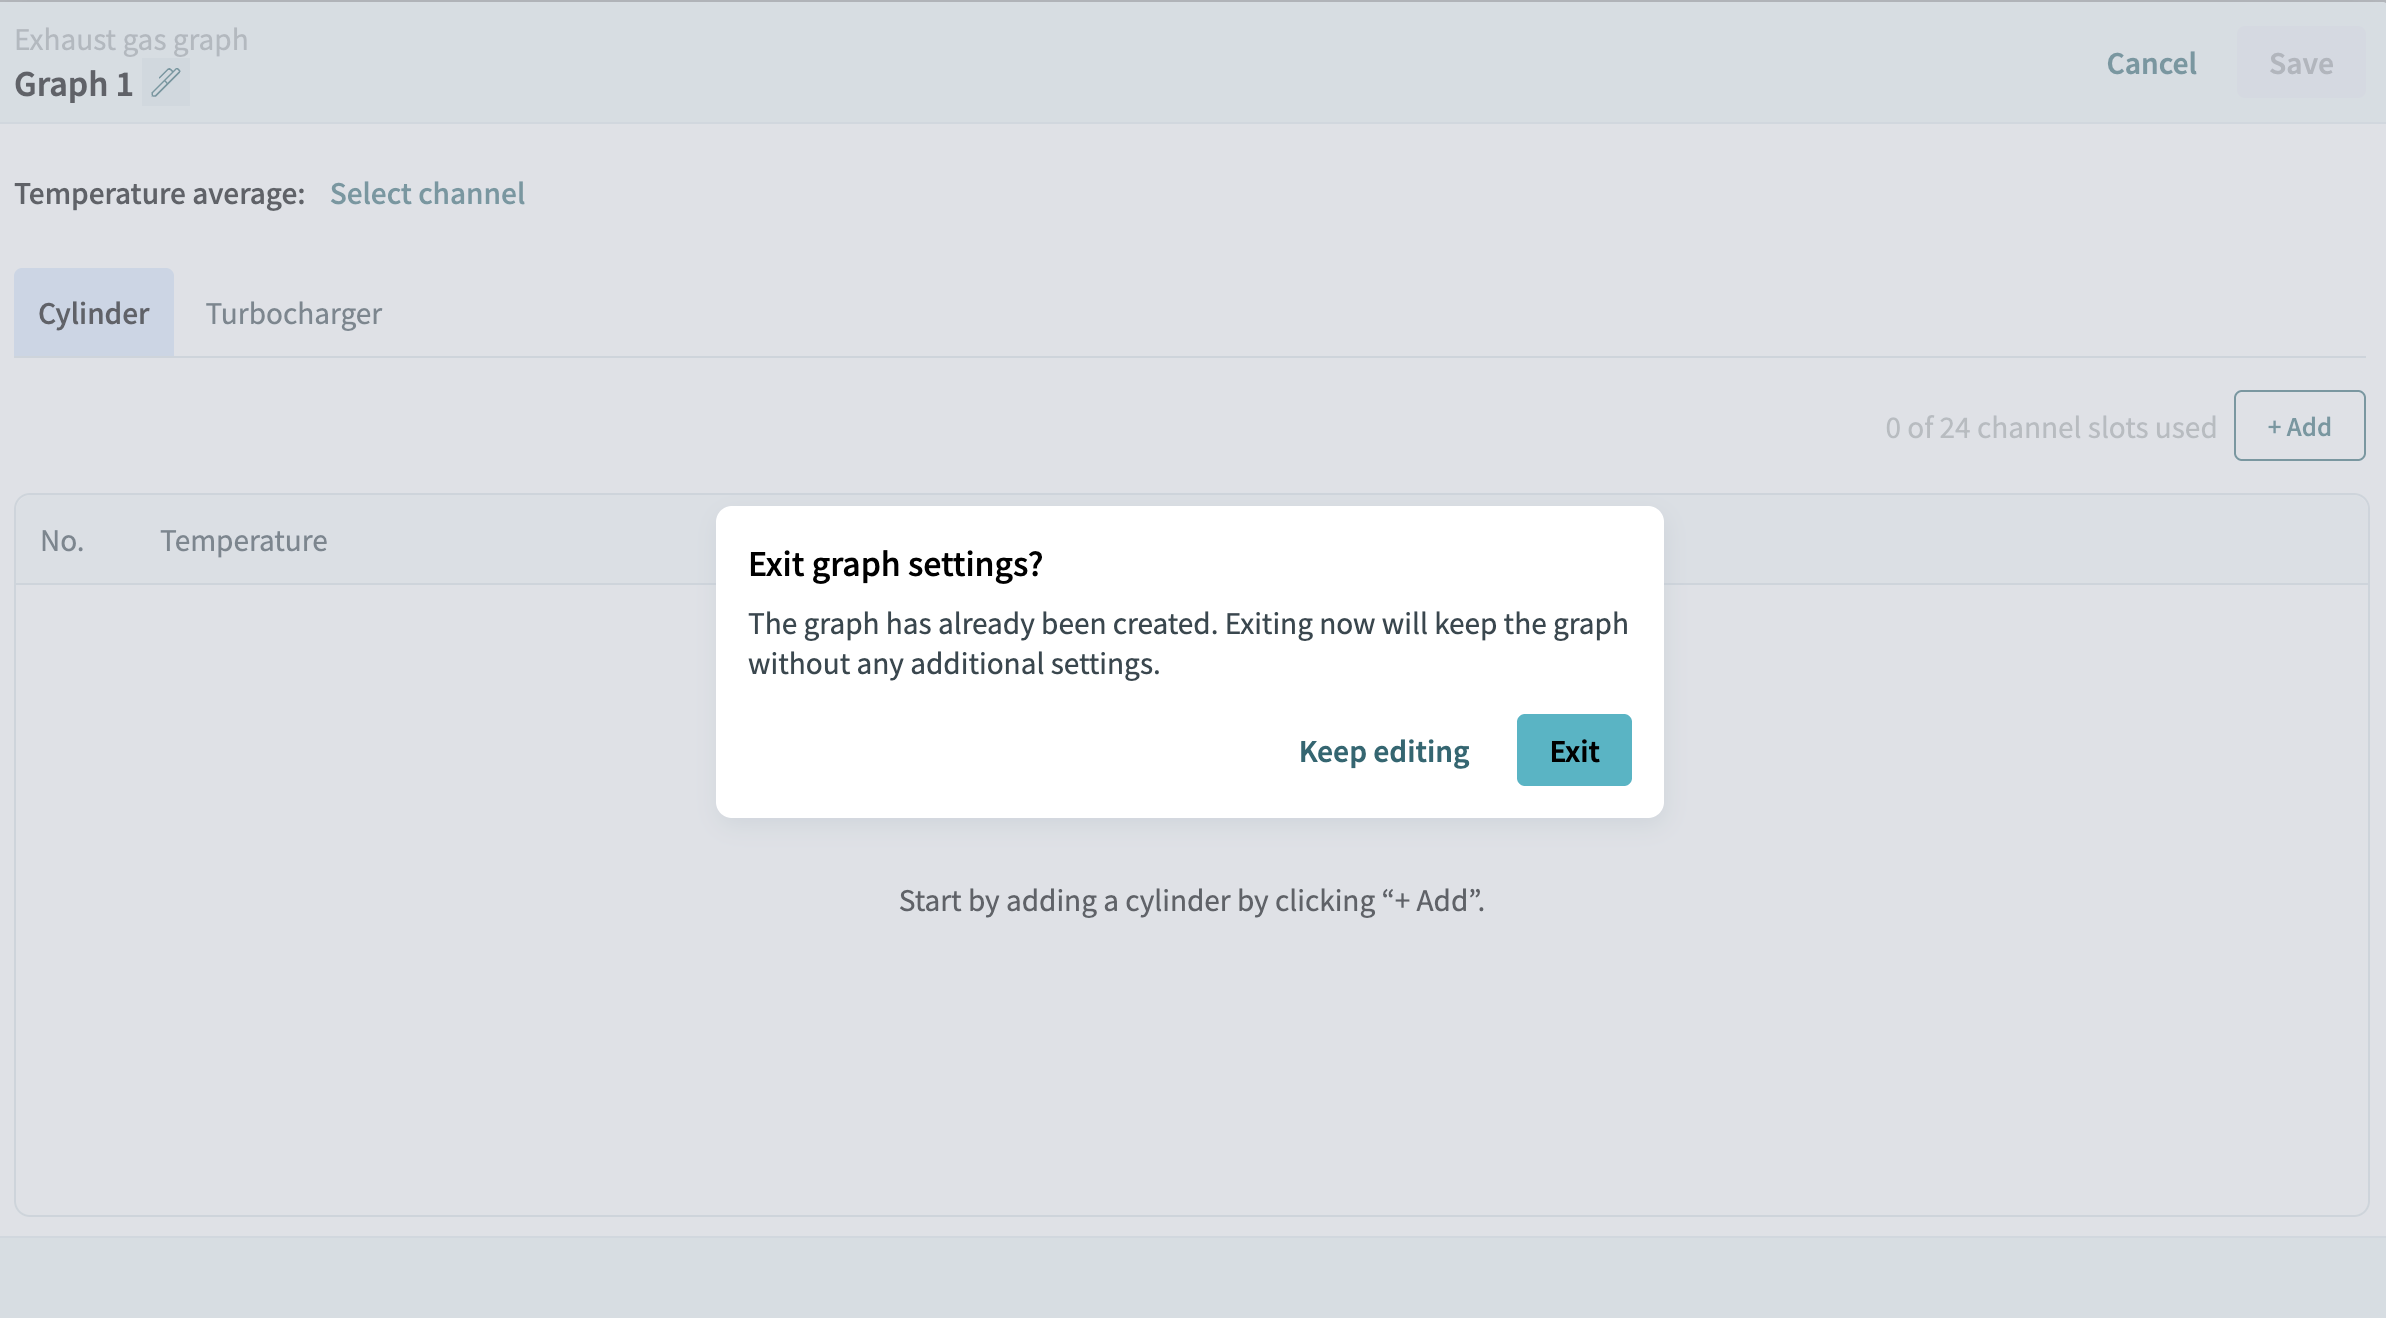
Click Keep Editing to return to the graph settings and make additional changes.
Click Exit to leave the graph settings without making any additional changes.
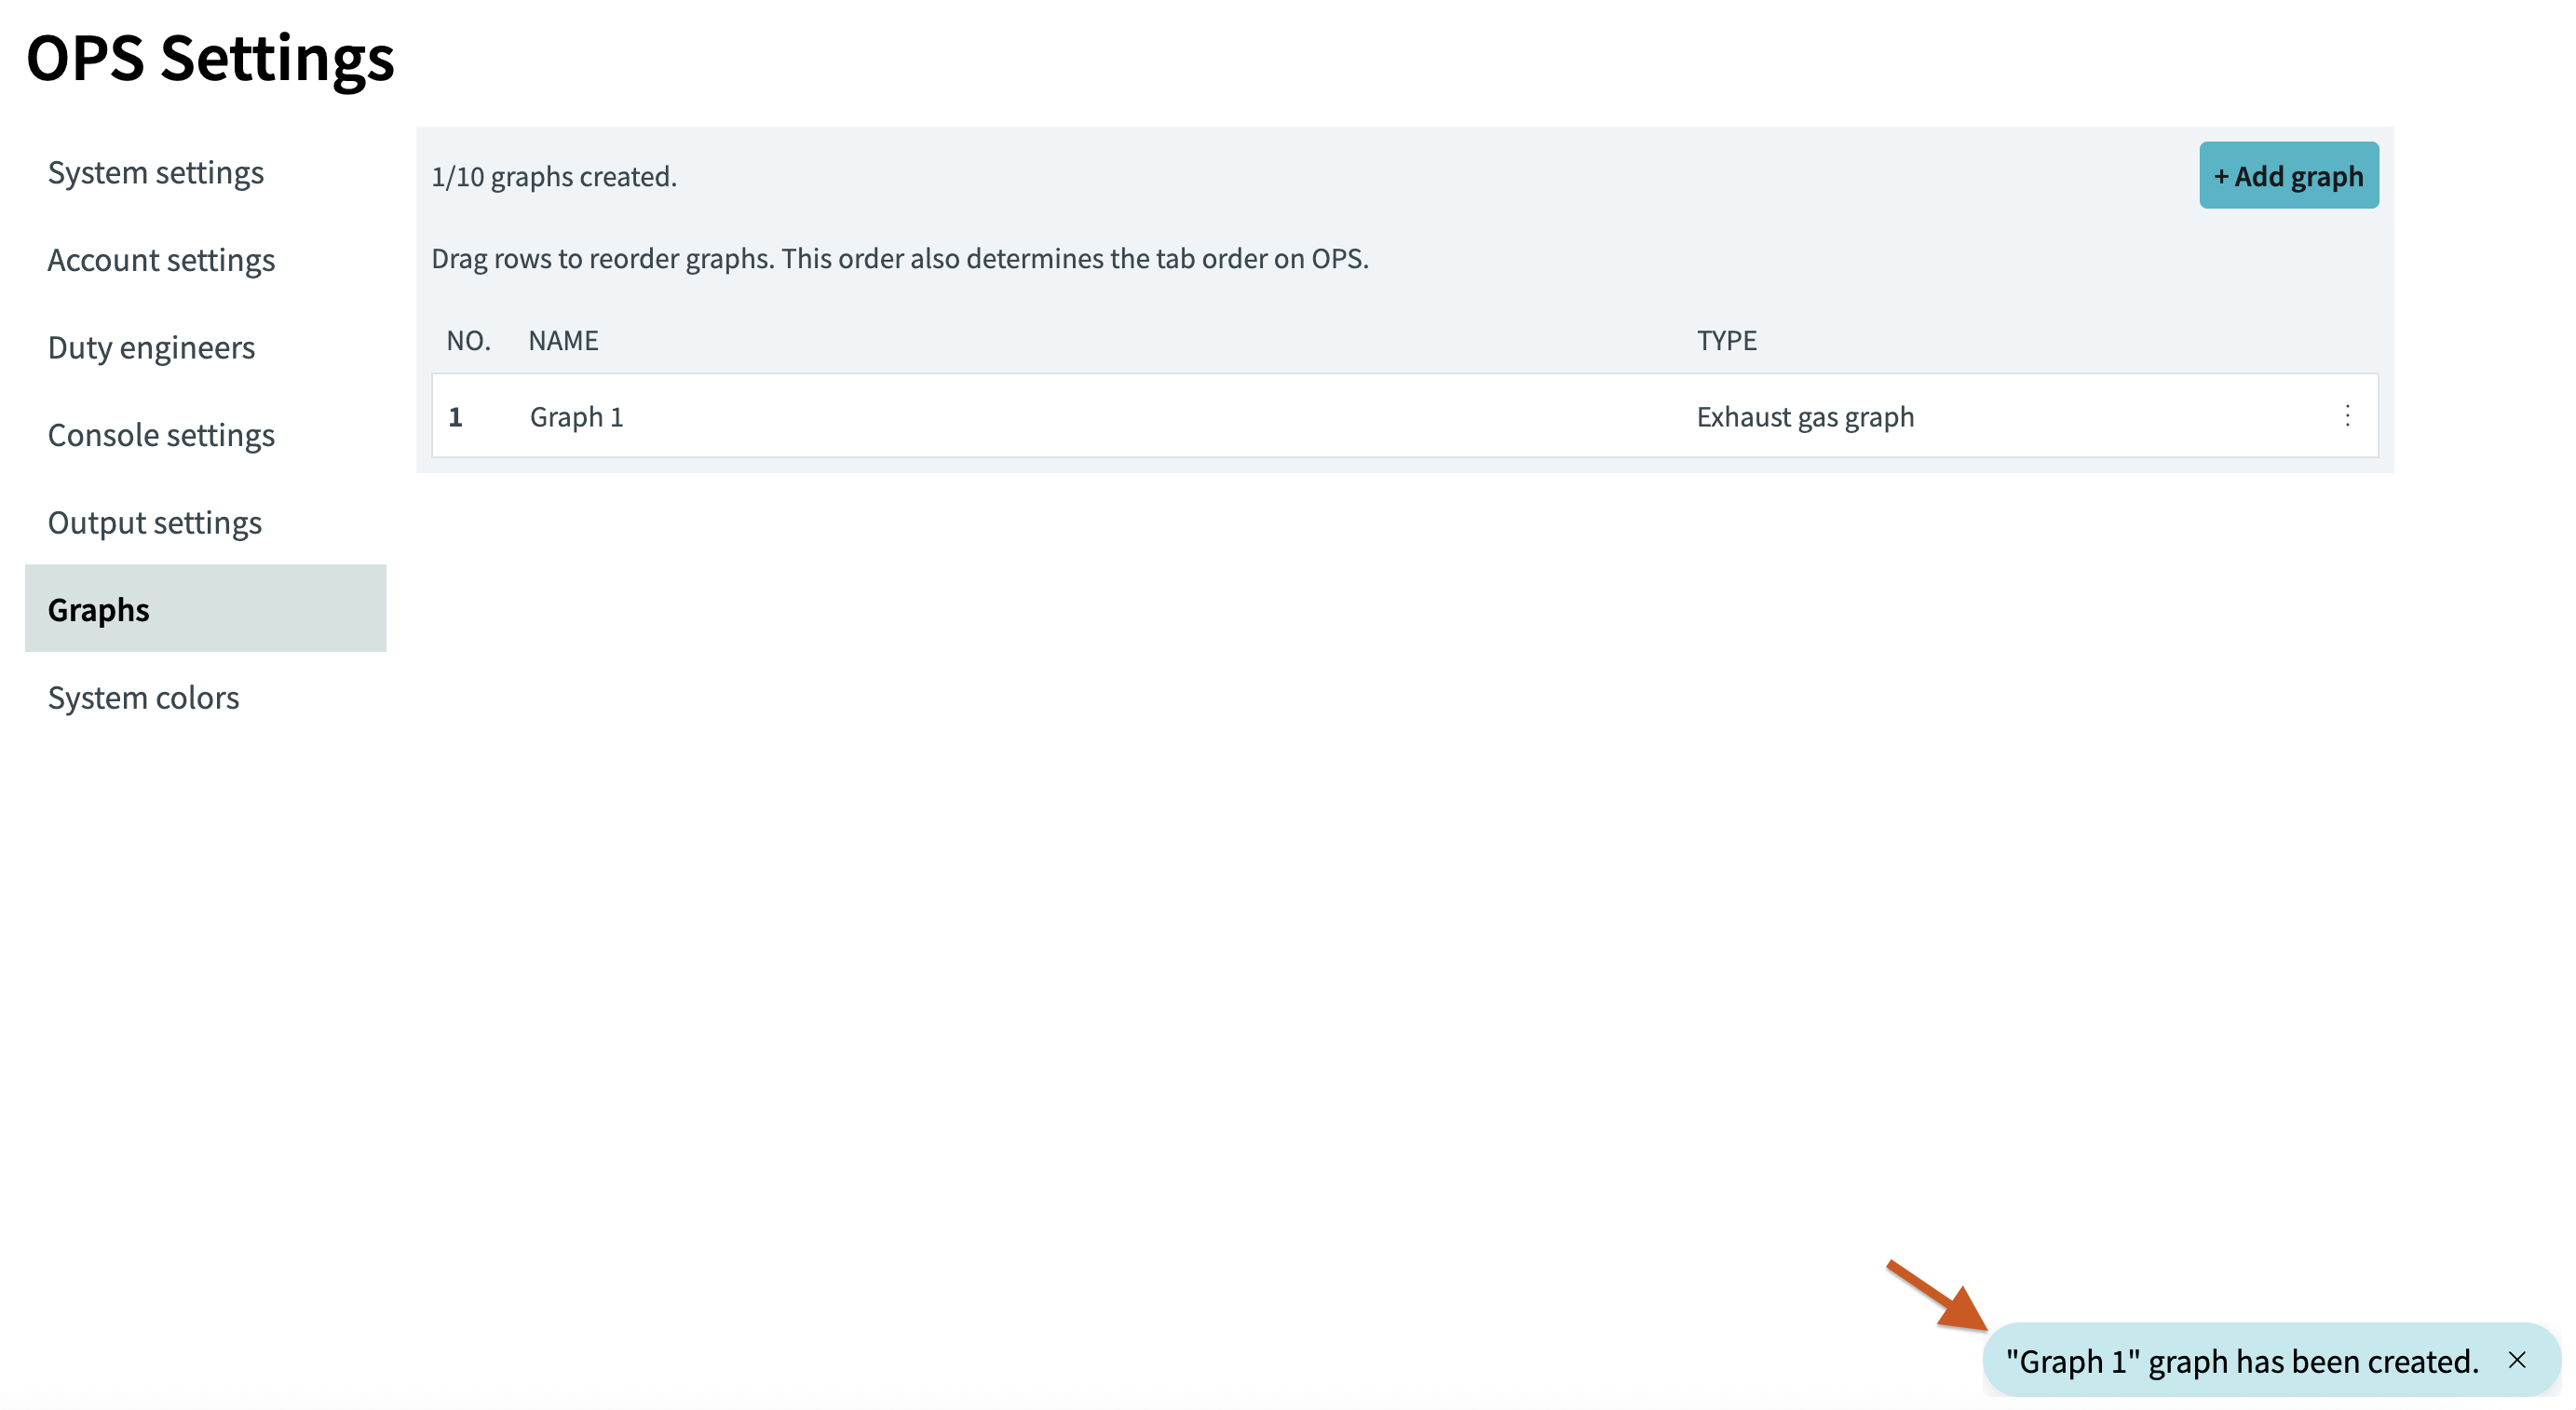
After exiting the graph settings, a confirmation message is displayed in the bottom-right corner, and the new graph appears in the graphs list.
3. Bar Graph Settings
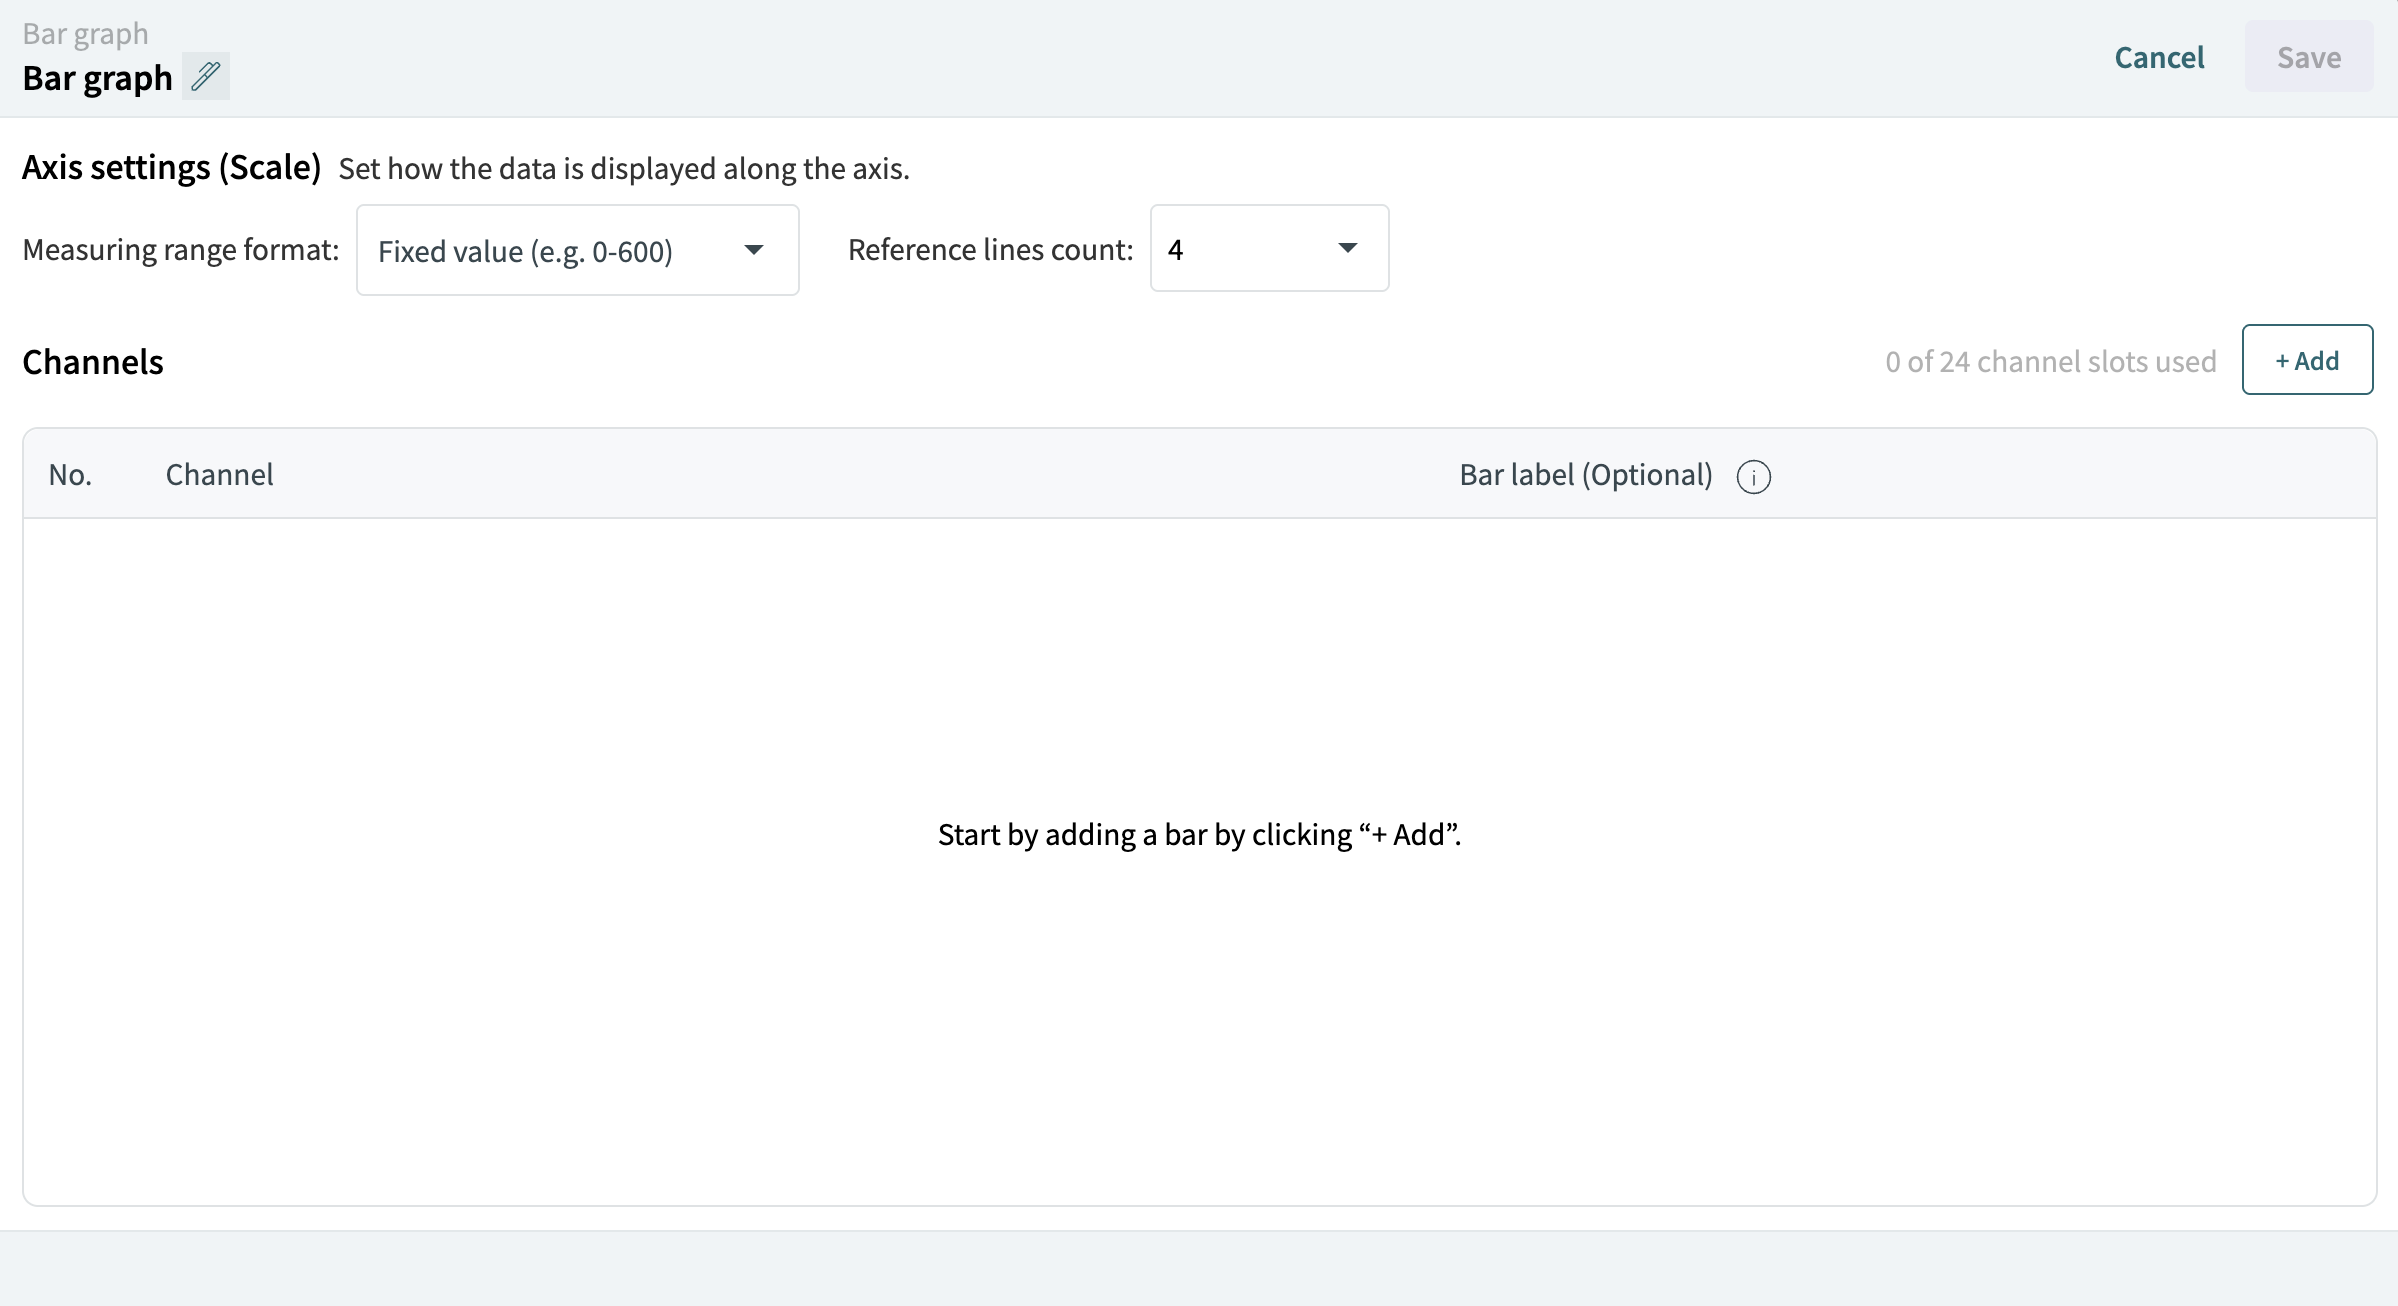
Select the measuring format for the bar graph:
-
Fixed value — Displays values within a fixed range from
0to600. -
Relative — Displays values as percentages (
%).
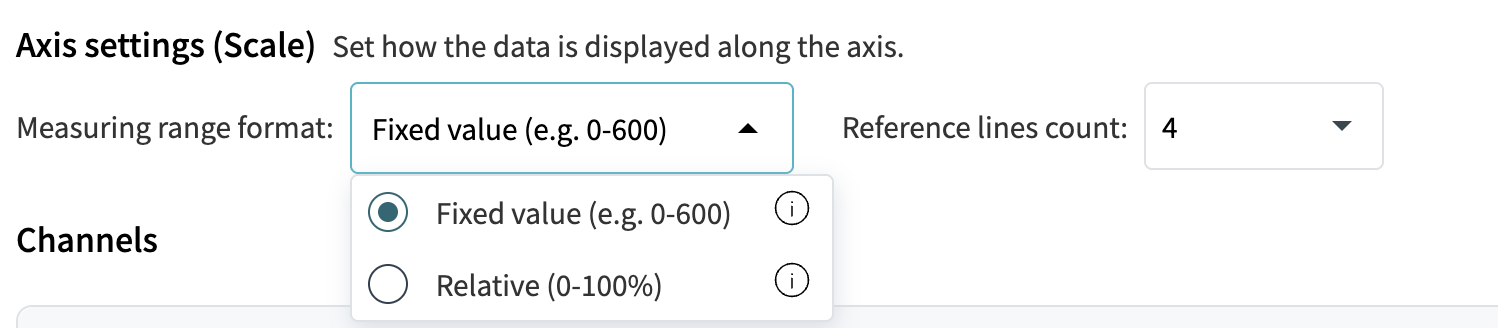
The default measuring format is Fixed Value.
Select the number of reference lines to display on the graph. The available options are 3, 4, 5, and 6.
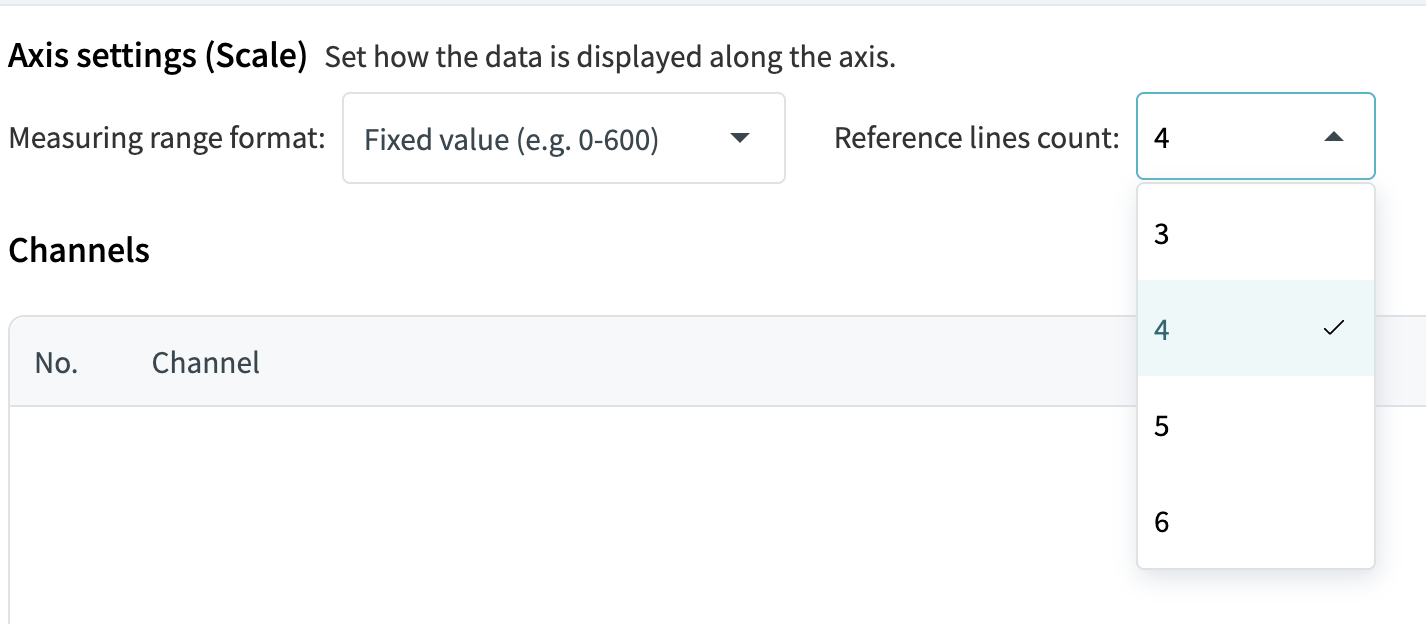
The default number of reference lines is 4.
You can add up to 24 rows to the bar graph. Only analog channels can be added.
To add a row, click + Add.
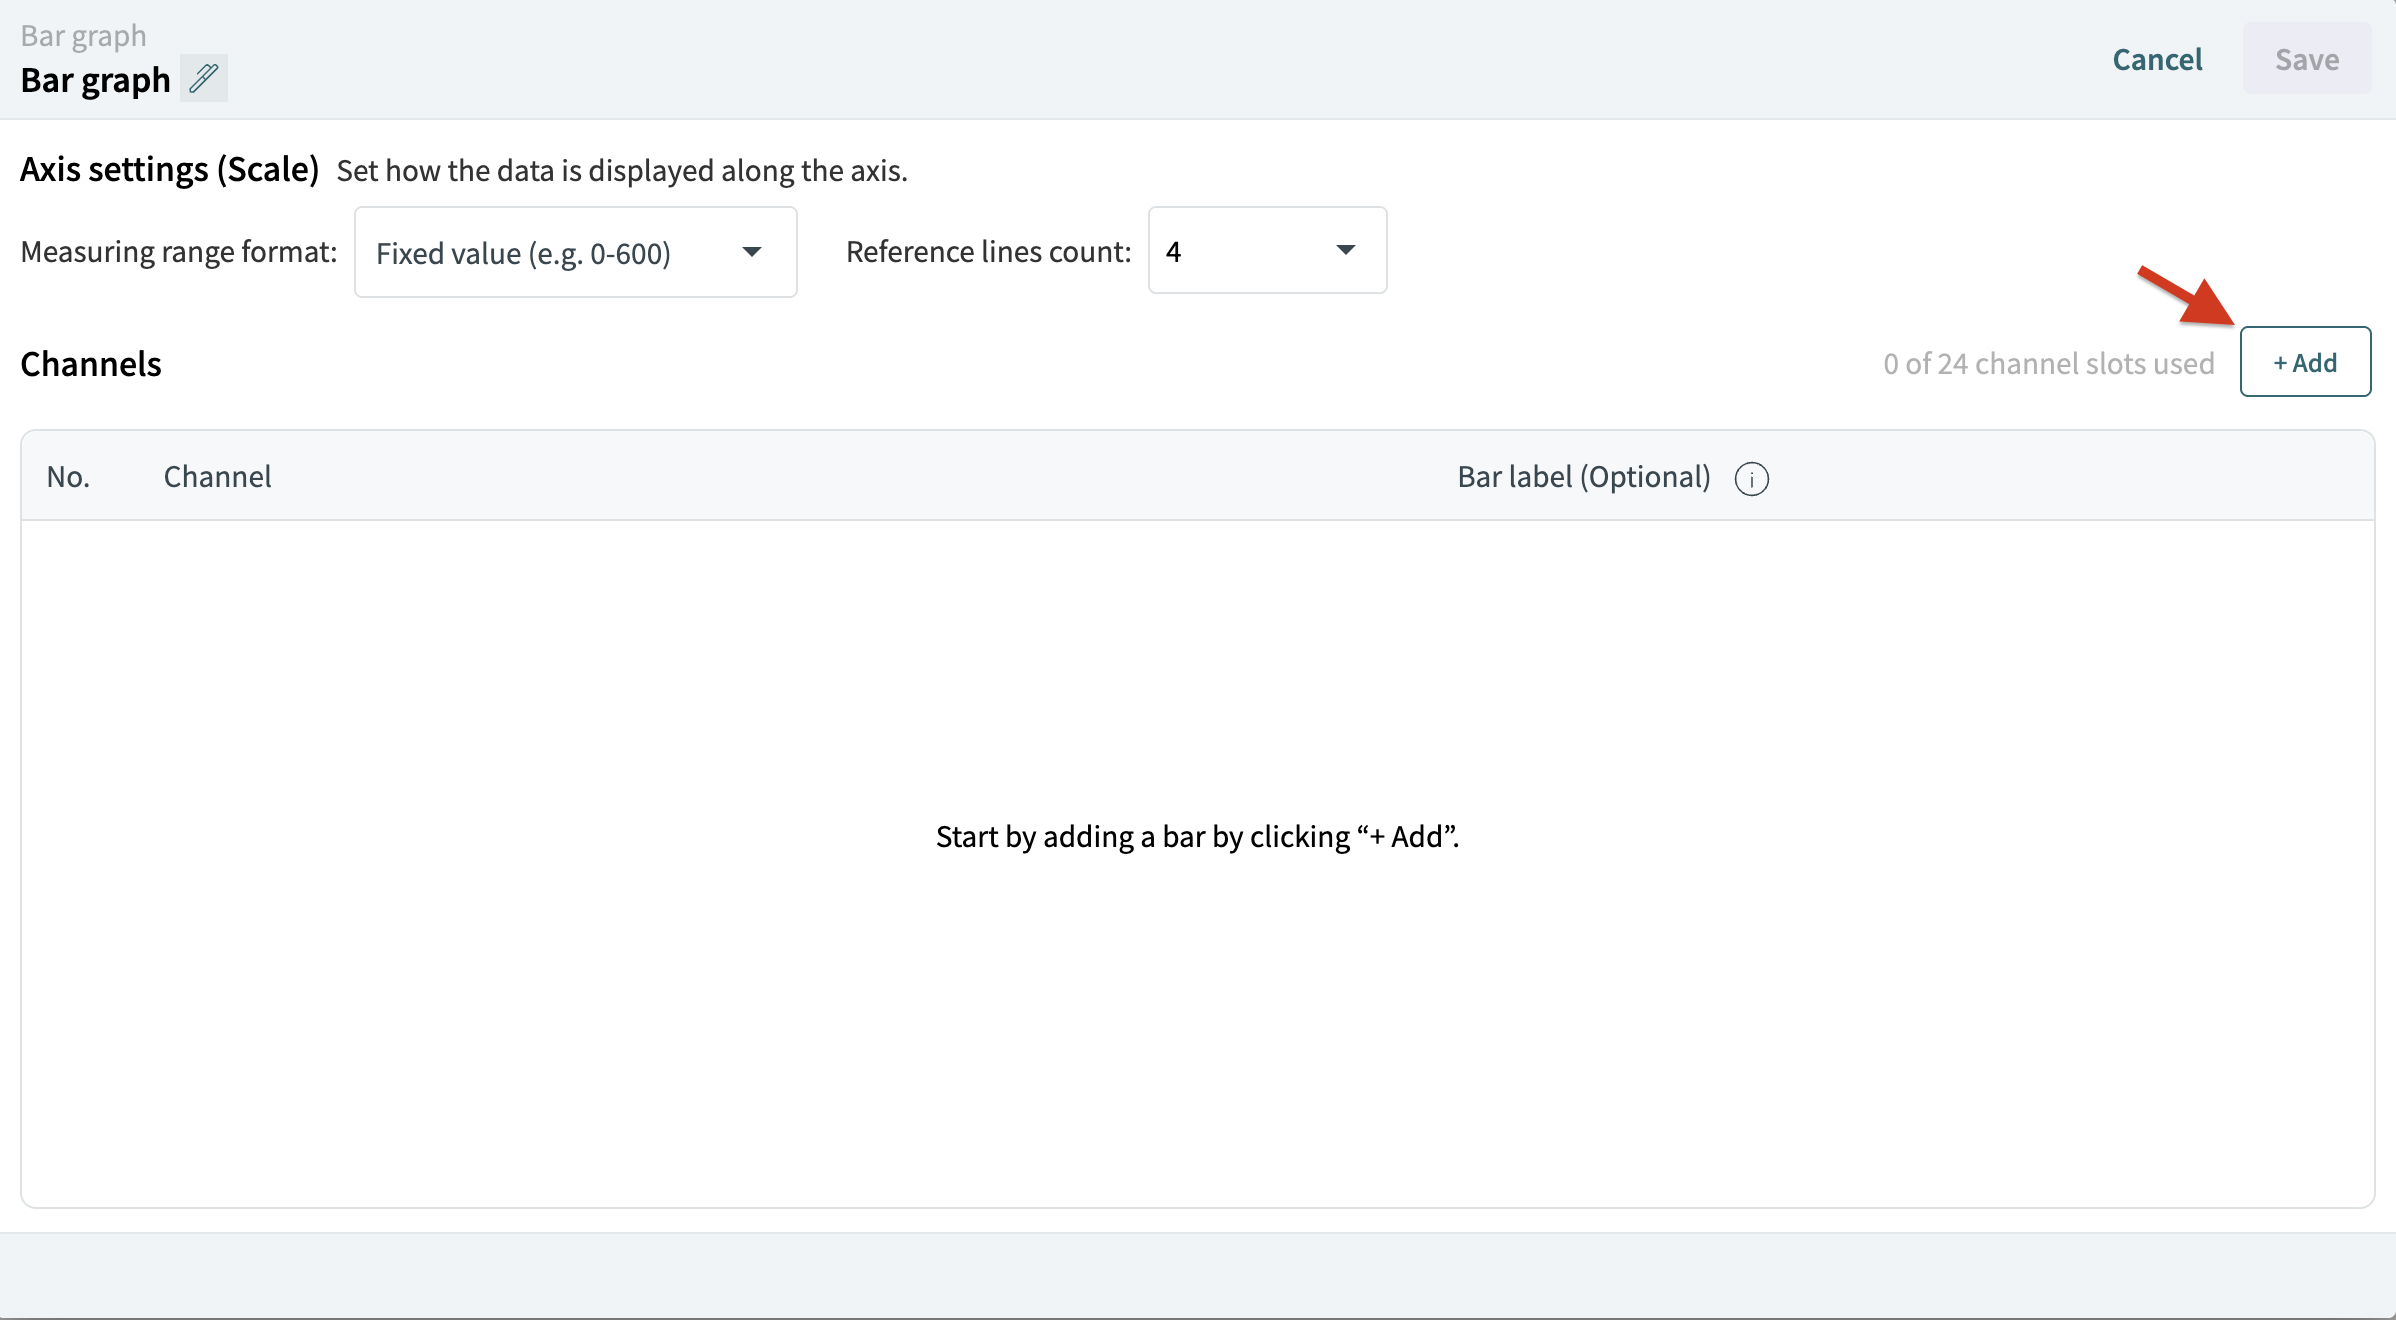
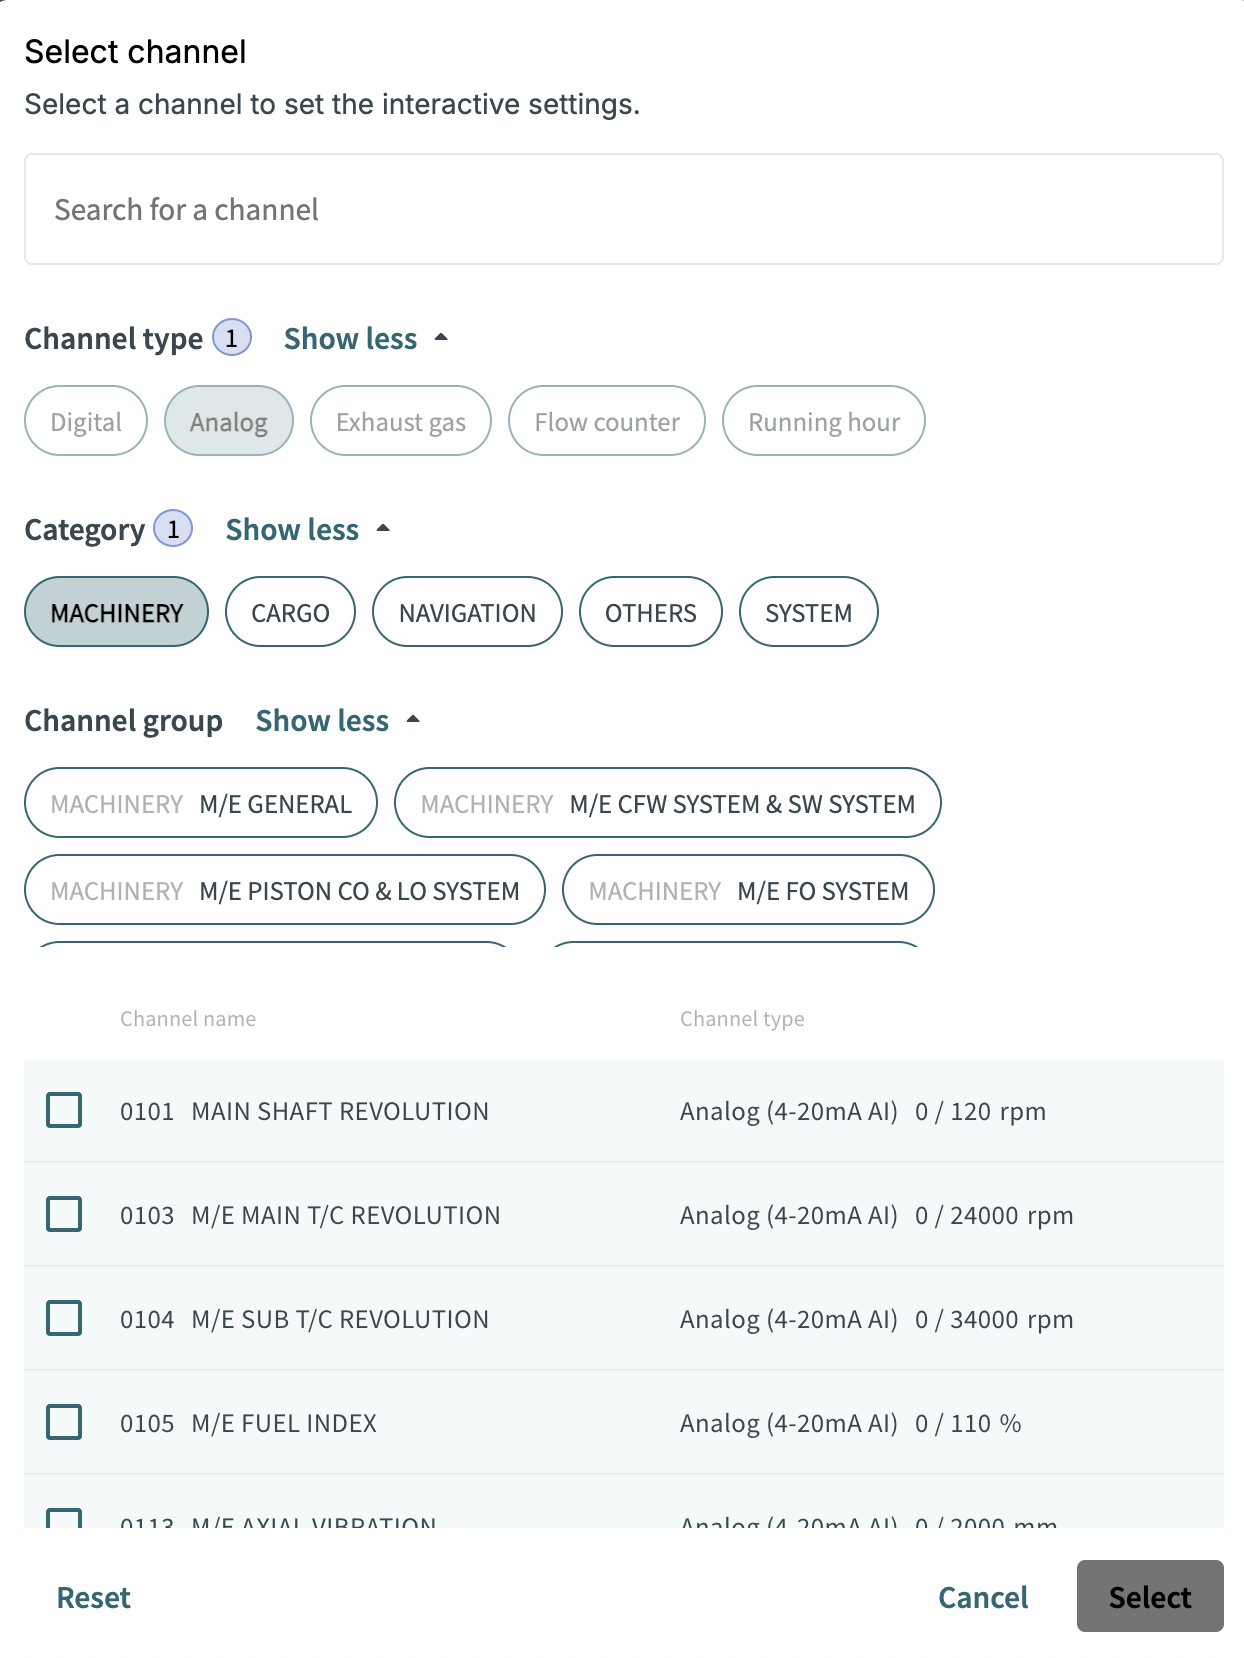
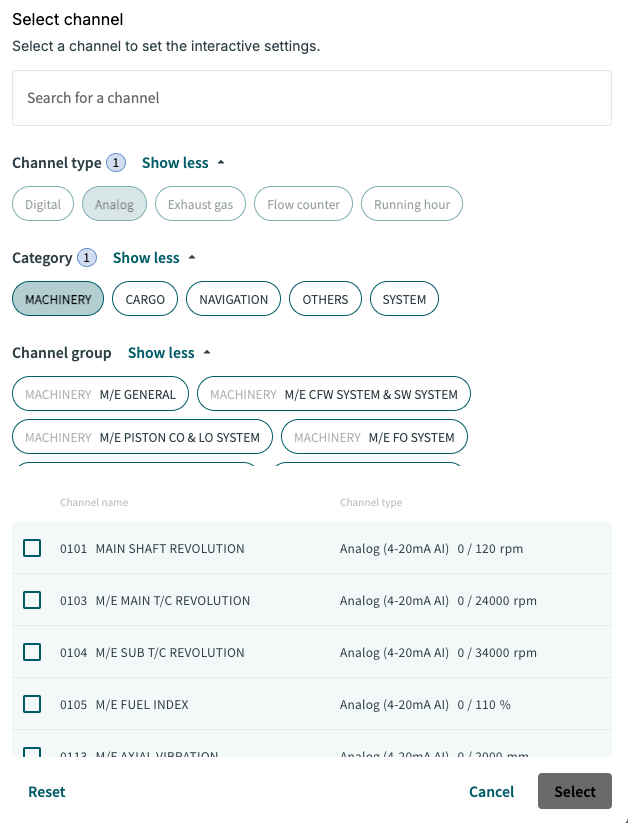
The "Select Channel" dialog is displayed. Select the required analog channel.
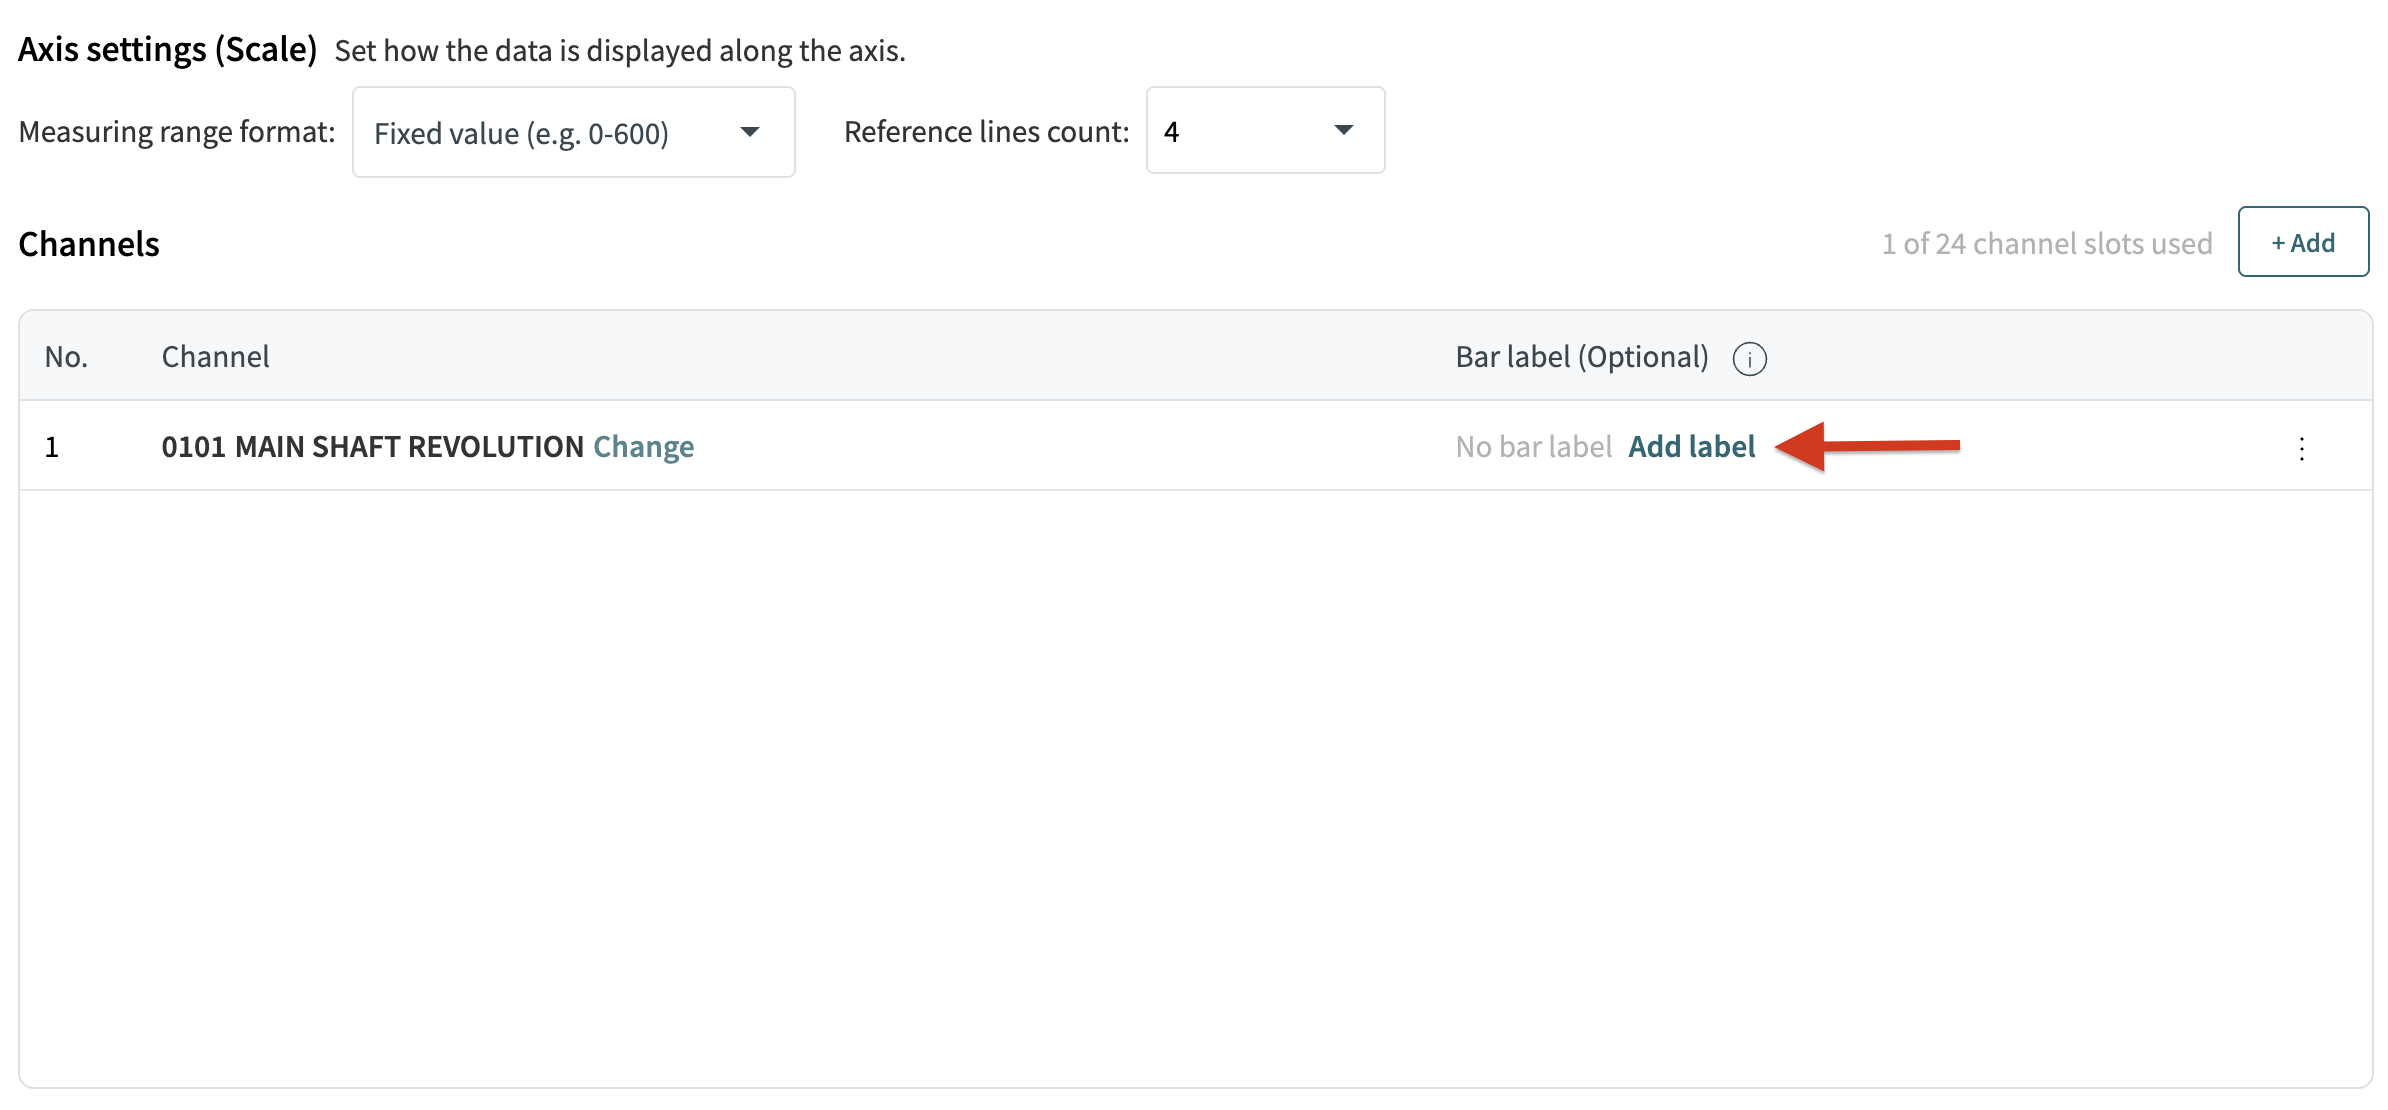
After adding a channel, you can optionally assign a custom bar label.
To add a bar label, click Add label in the row.
The "Bar Label" dialog is displayed.
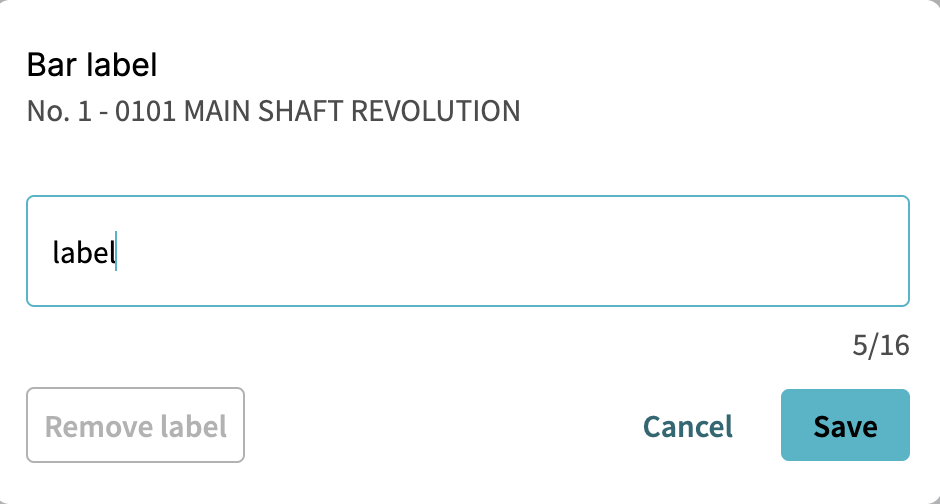
Enter the desired label and click Save.
If a custom bar label has already been assigned, click Change button next to the label to open the "Bar Label" dialog.
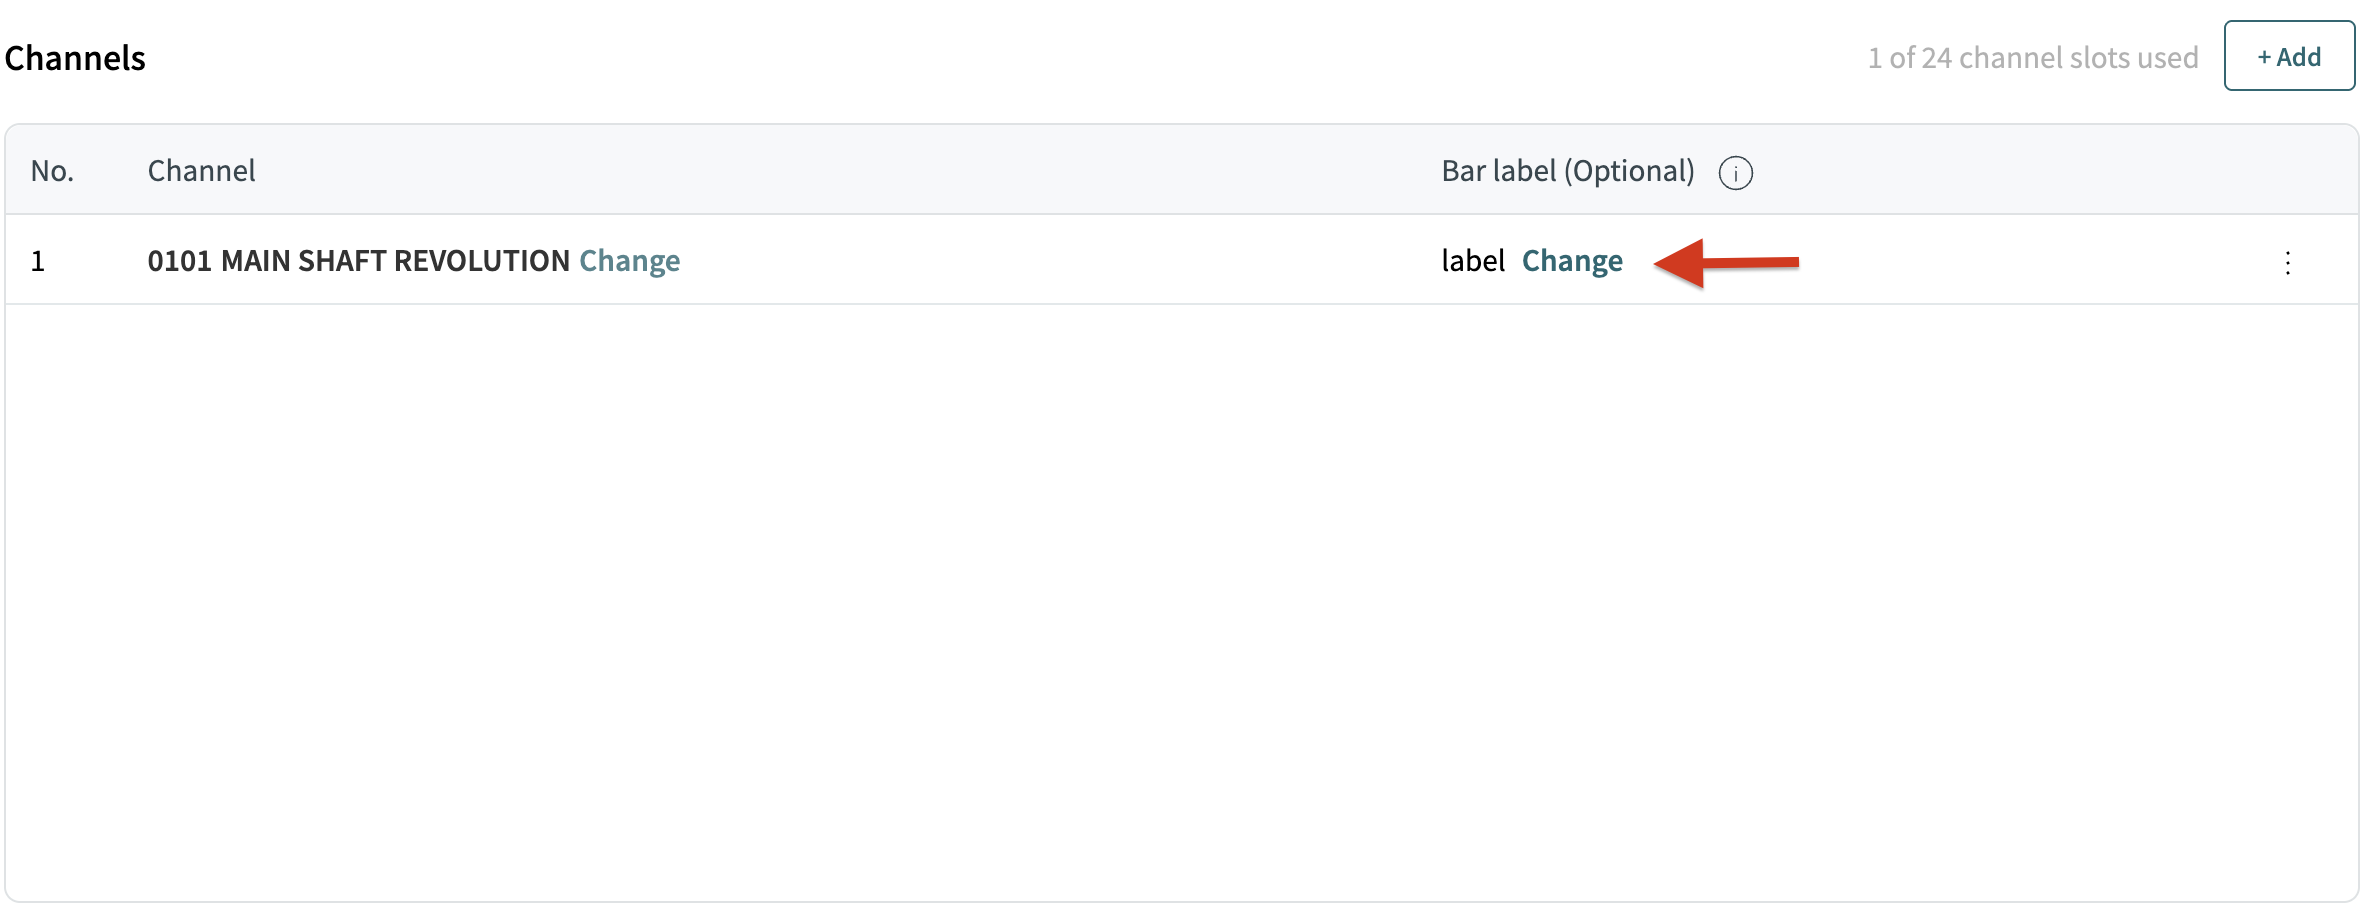
To restore the default label, click Remove label.
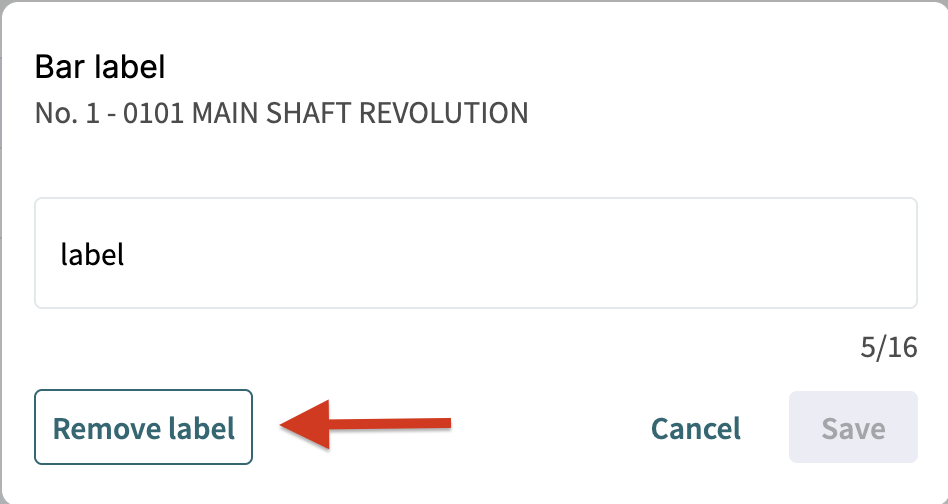
|
If no custom bar label is assigned, the channel is labeled with its corresponding number from the No. column. |
To clear the channel and its bar label, open the channel options menu and select Clear.
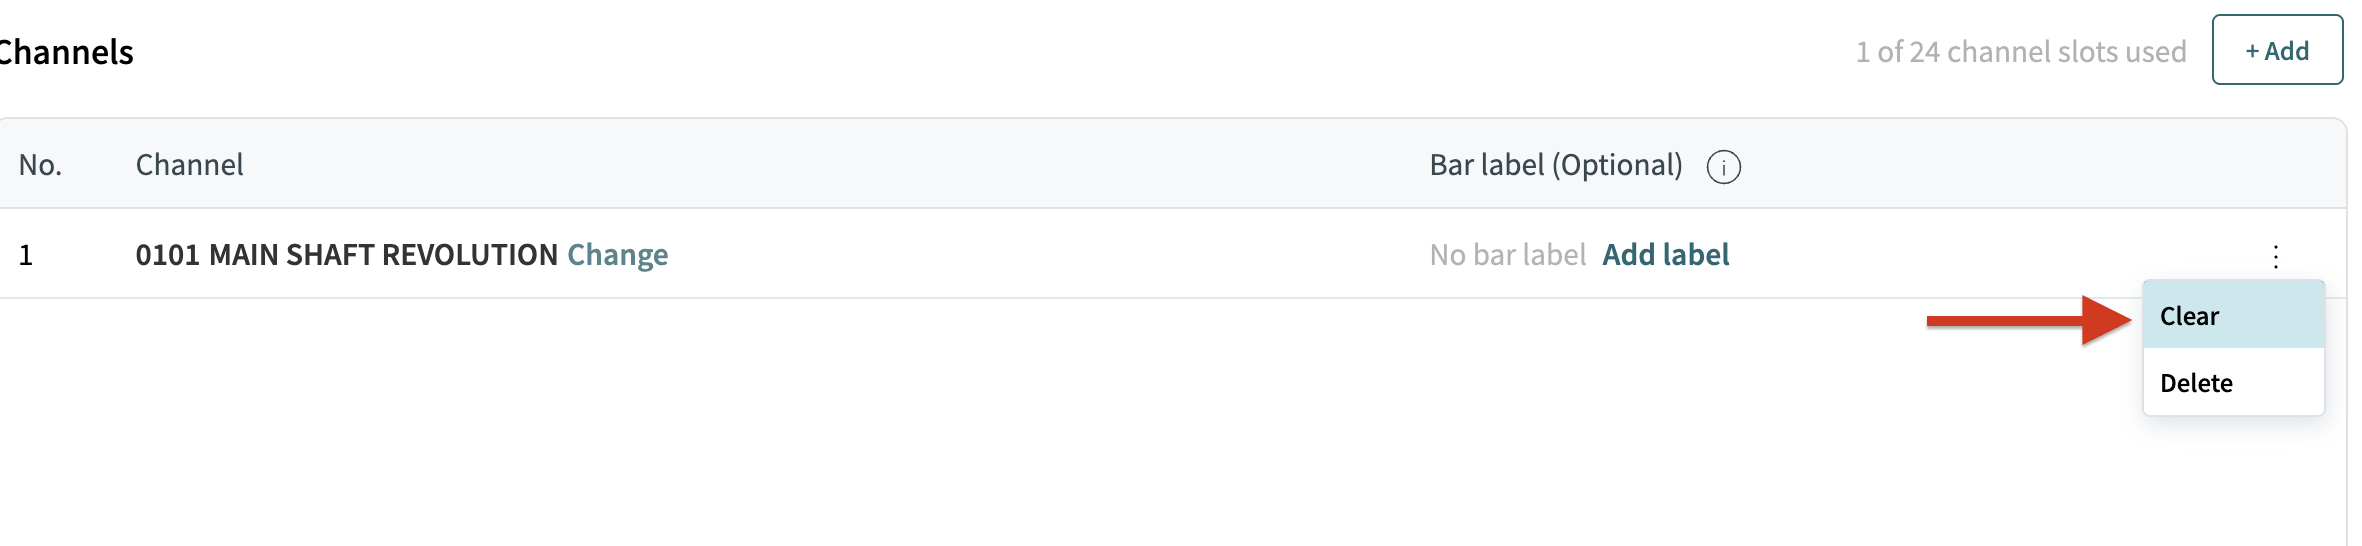

|
The Clear option is disabled when the channel does not have a selected channel or a custom bar label. |
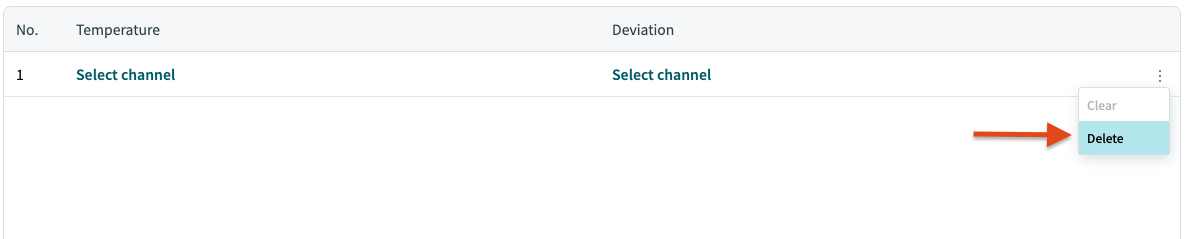
To delete a channel row from the graph, open the channel options menu and select Delete.

4. Gauge Graph Settings
You can add up to 8 rows to the gauge graph. Only analog channels can be added.
To add a row, click + Add.
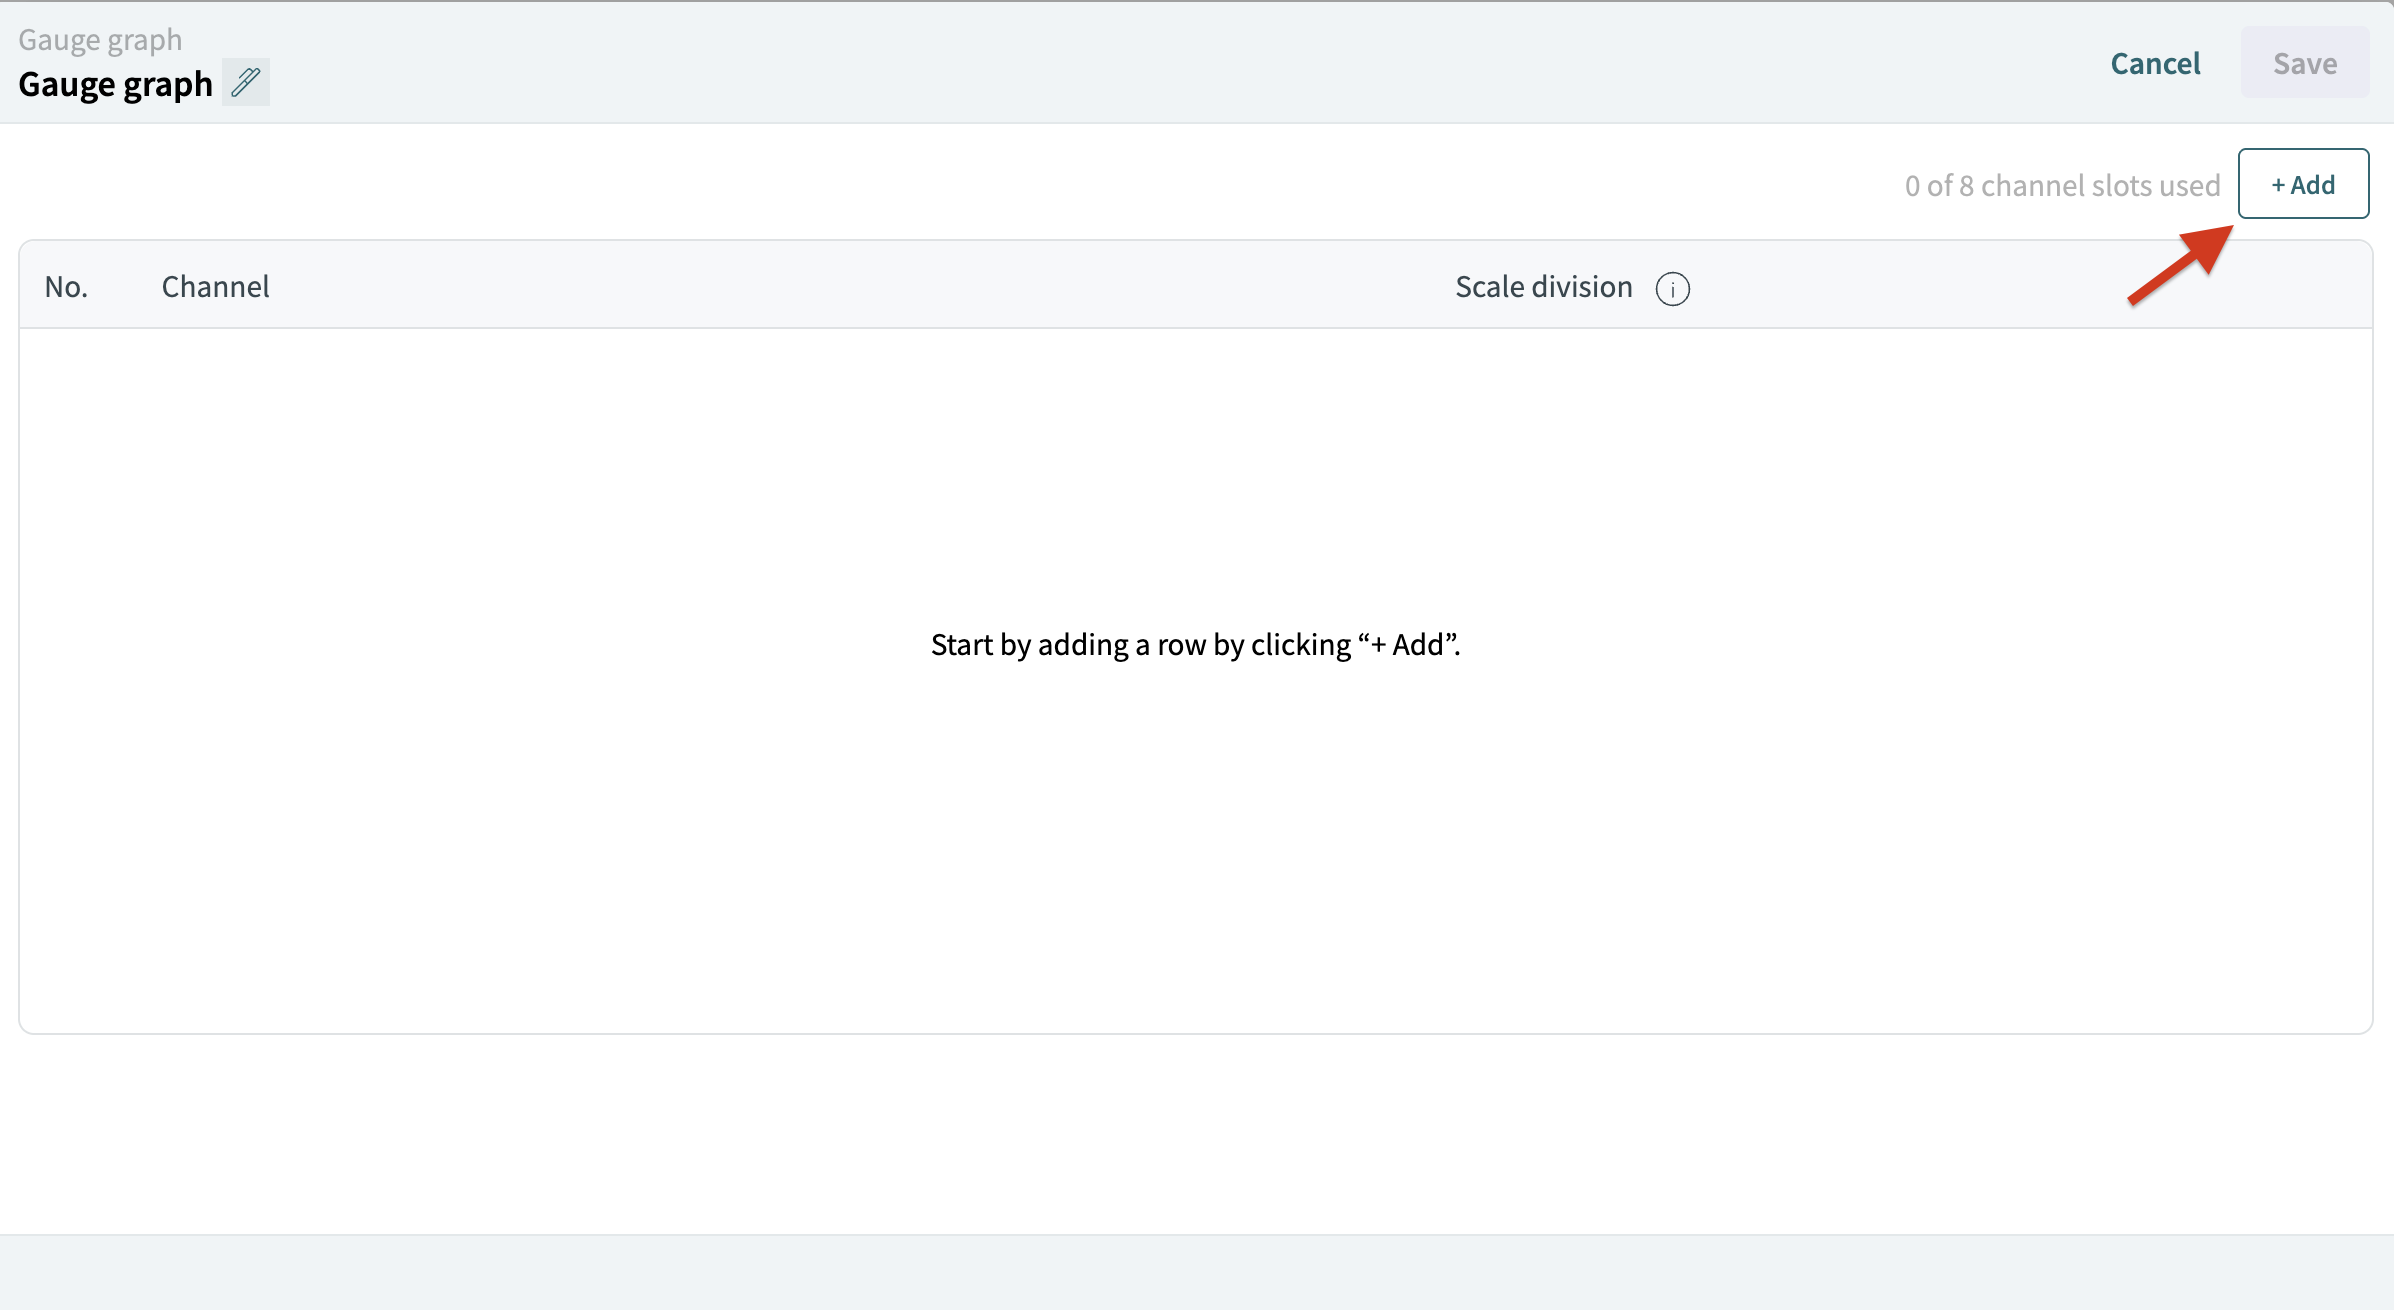
The "Select channel" dialog is displayed. Select the required analog channel.
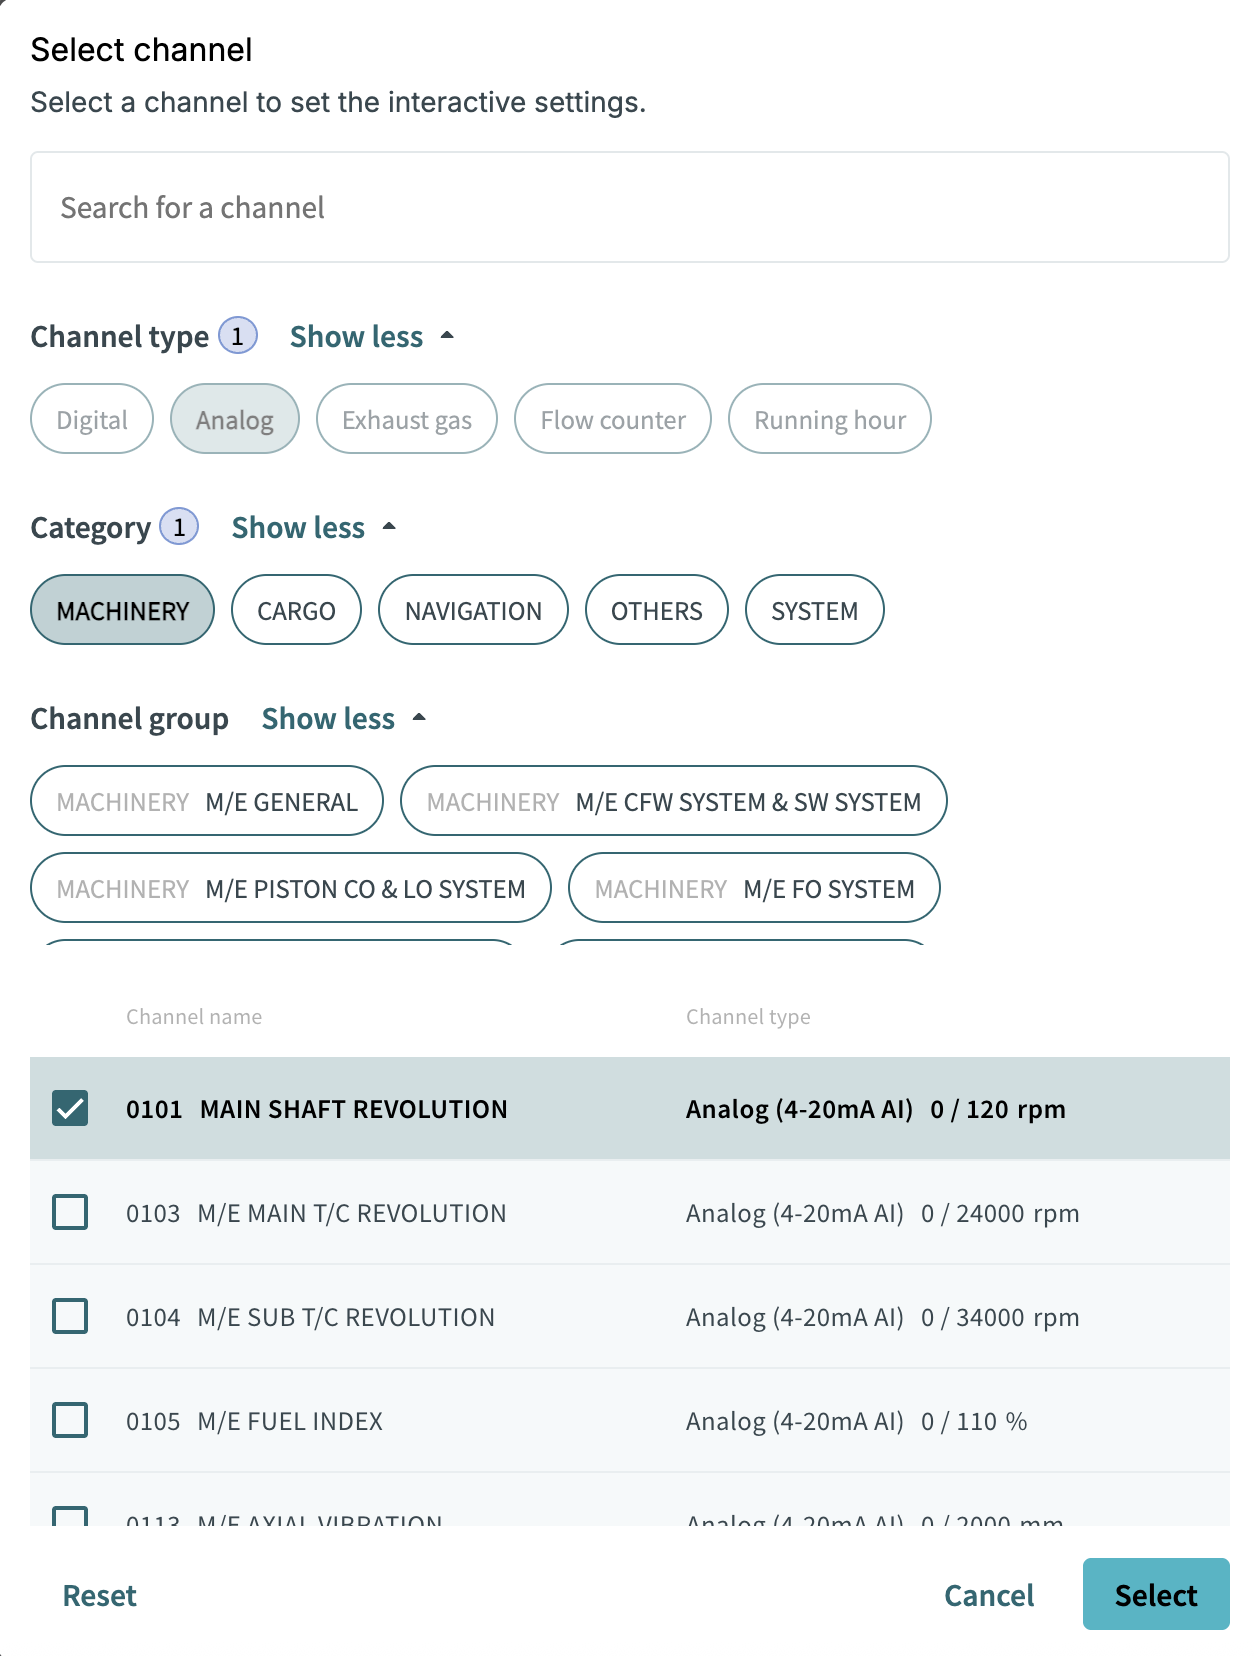
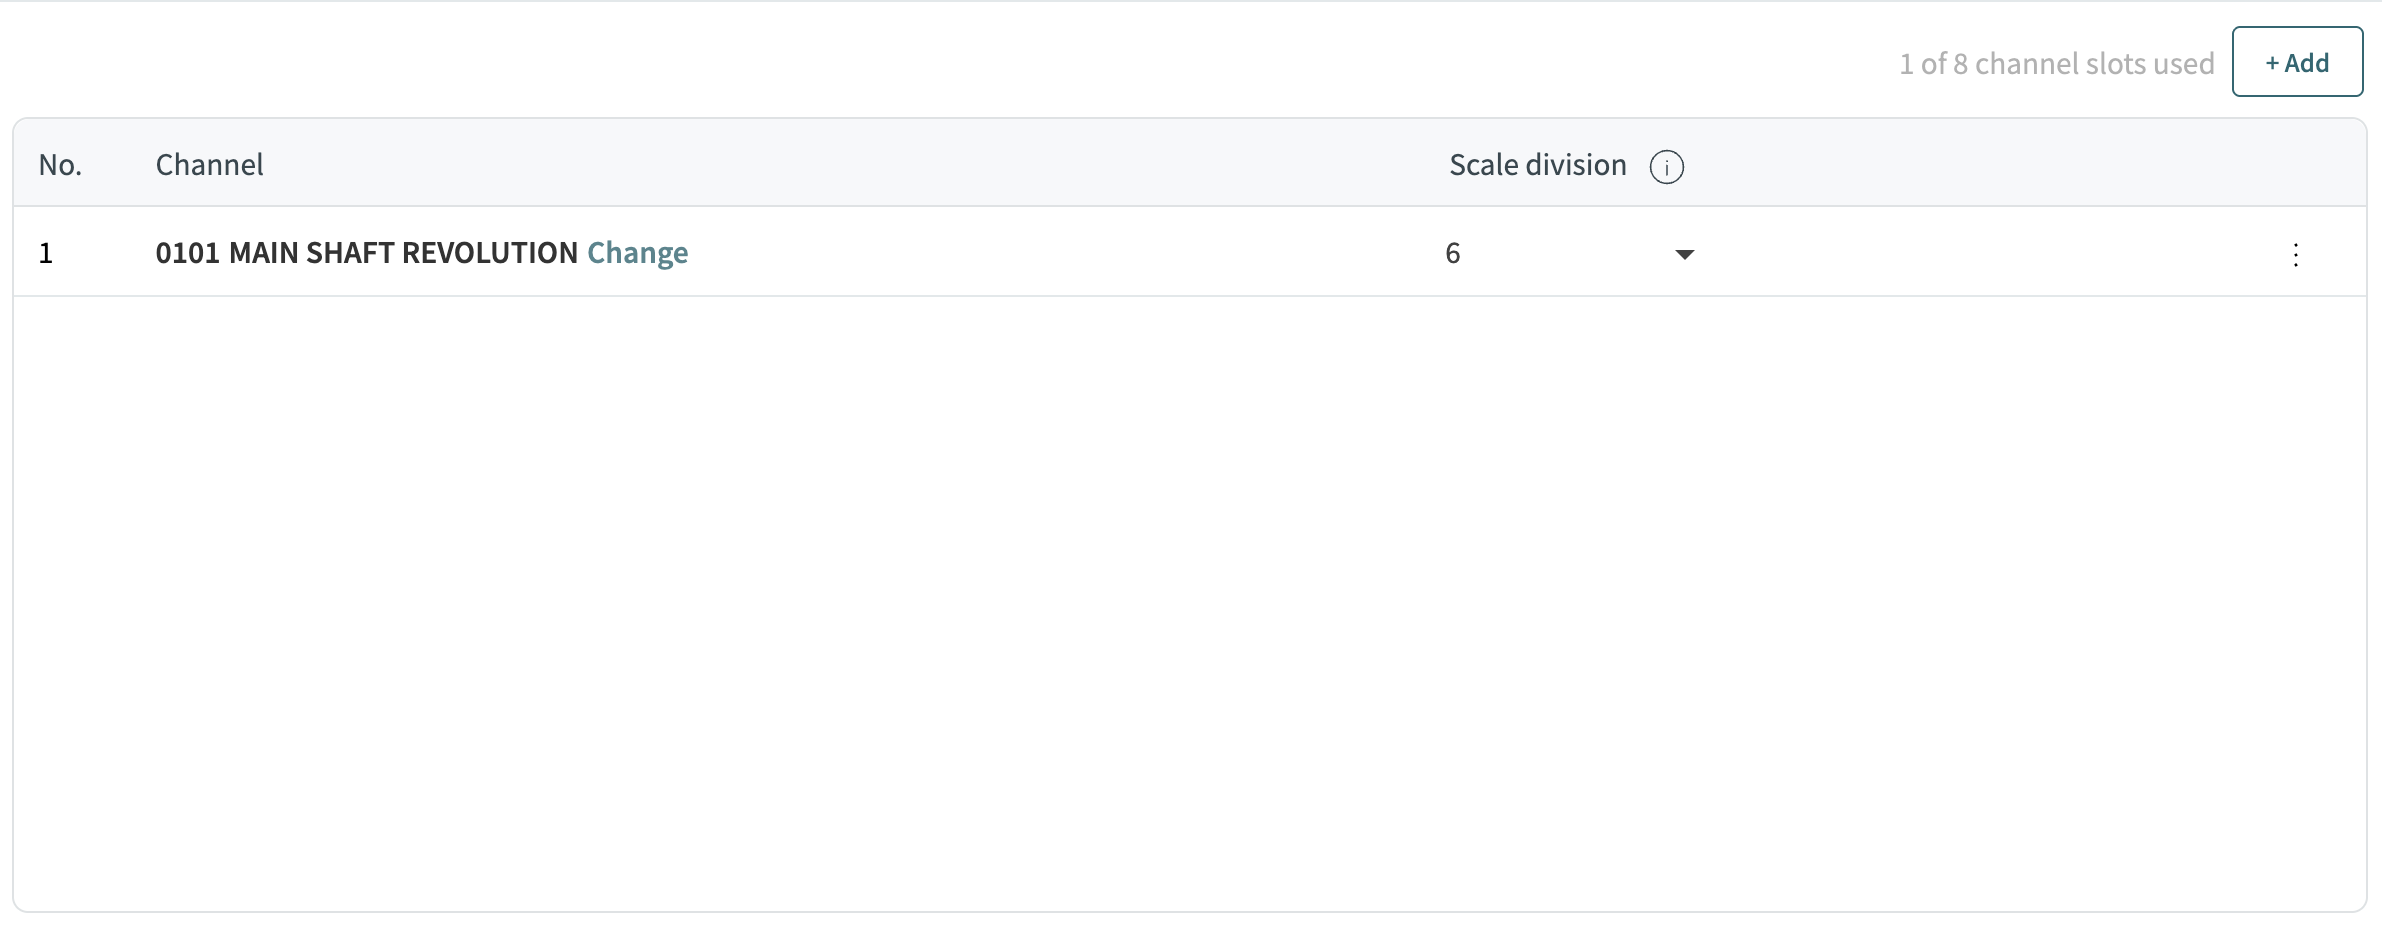
After adding a channel, the gauge scale division is automatically calculated based on the selected channel’s measurable range and scale.
To manually change the scale division, click the scale division value to open the dropdown list.
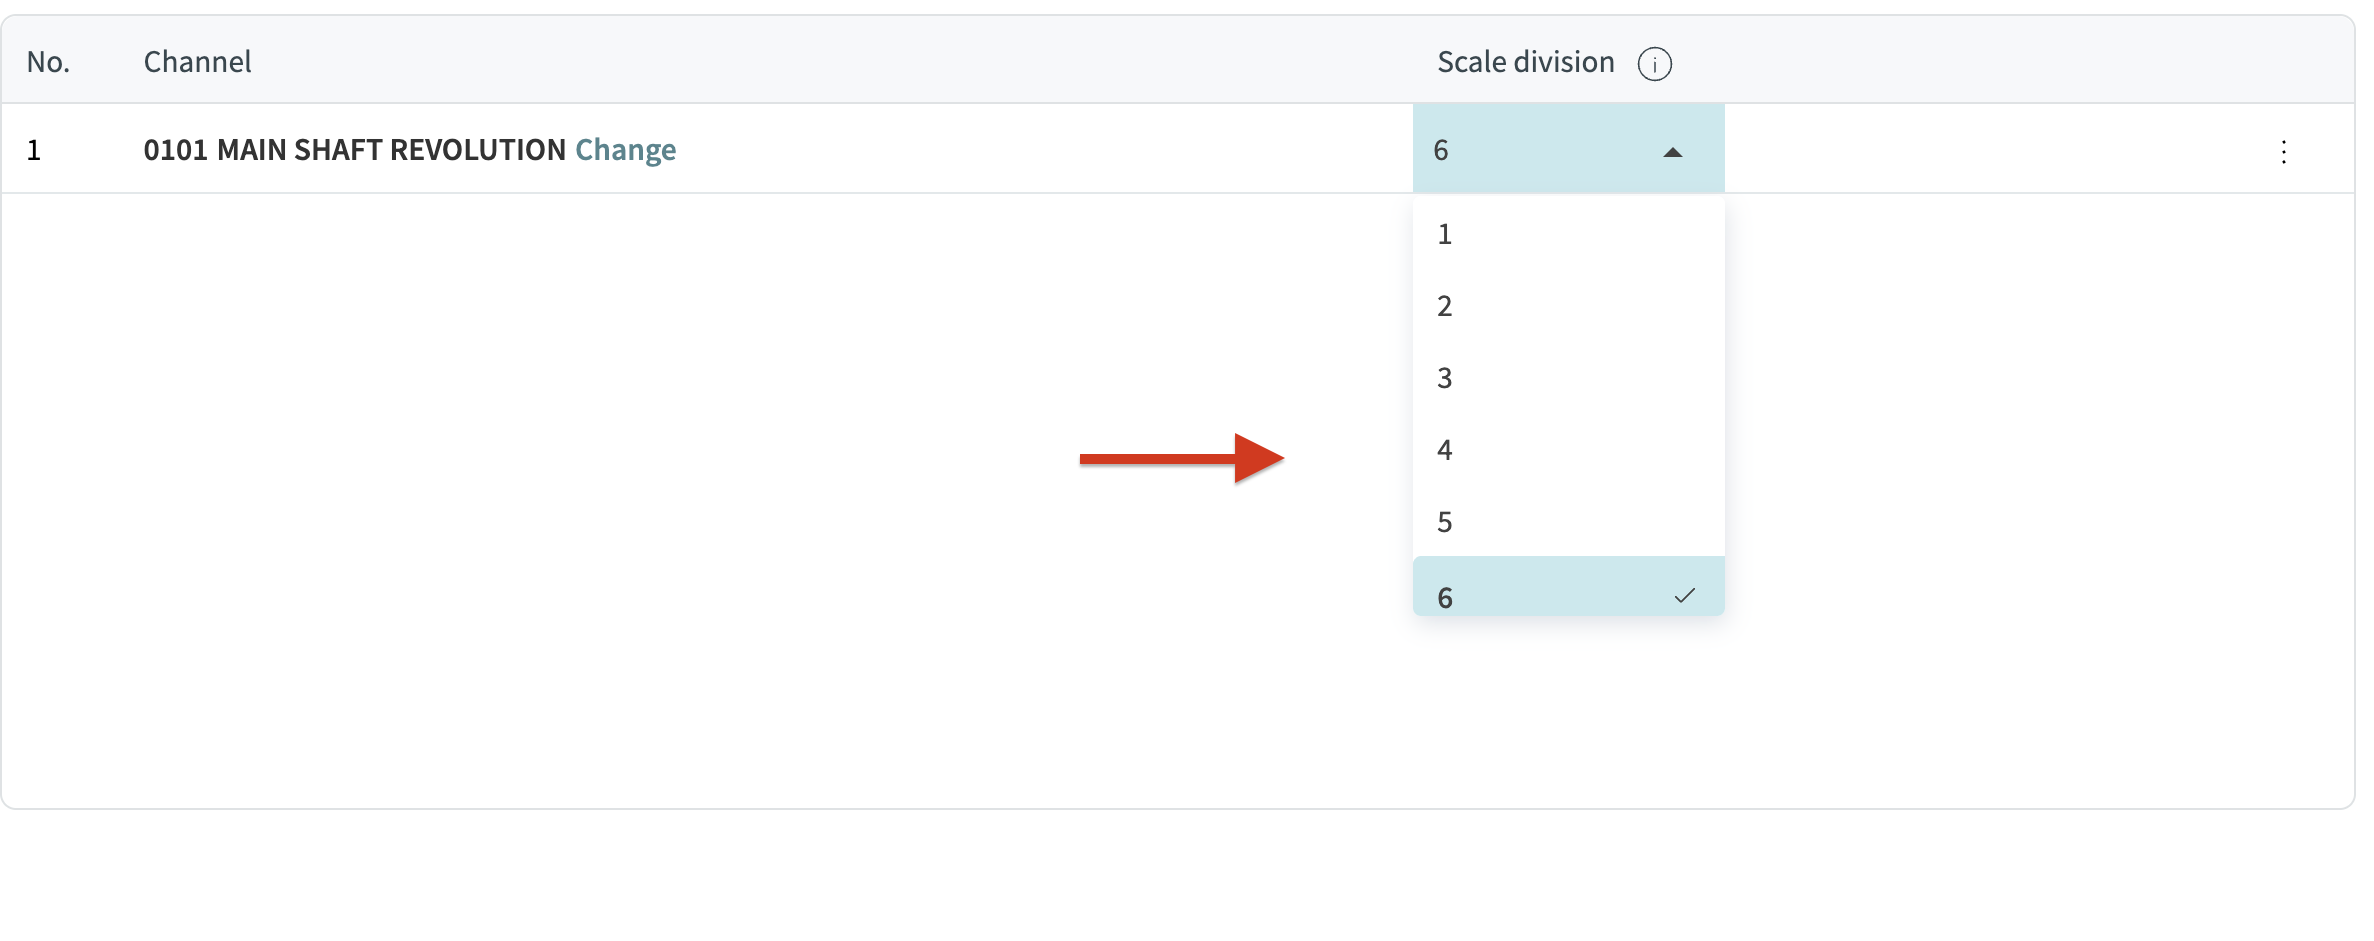
Select the required scale division from 1 to 11.
|
If a suitable scale division cannot be calculated automatically, the default gauge scale division is used. |
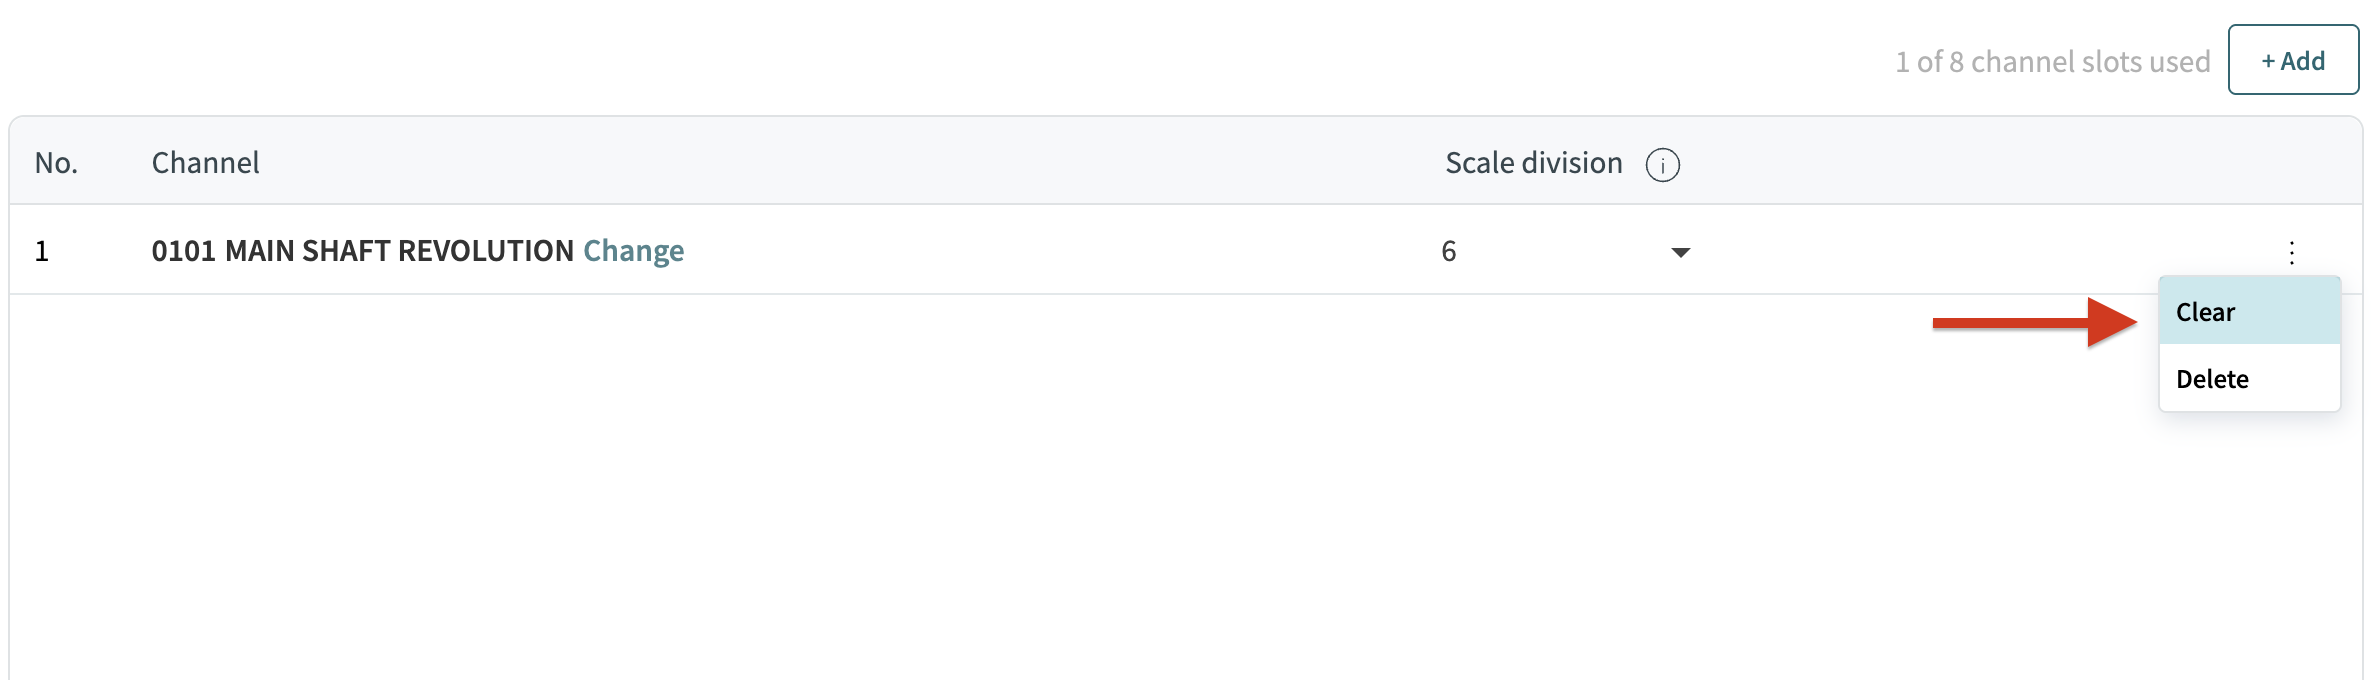
To clear the selected channel, open the channel options menu and select Clear.
|
The Clear option is disabled when no channel is selected. |
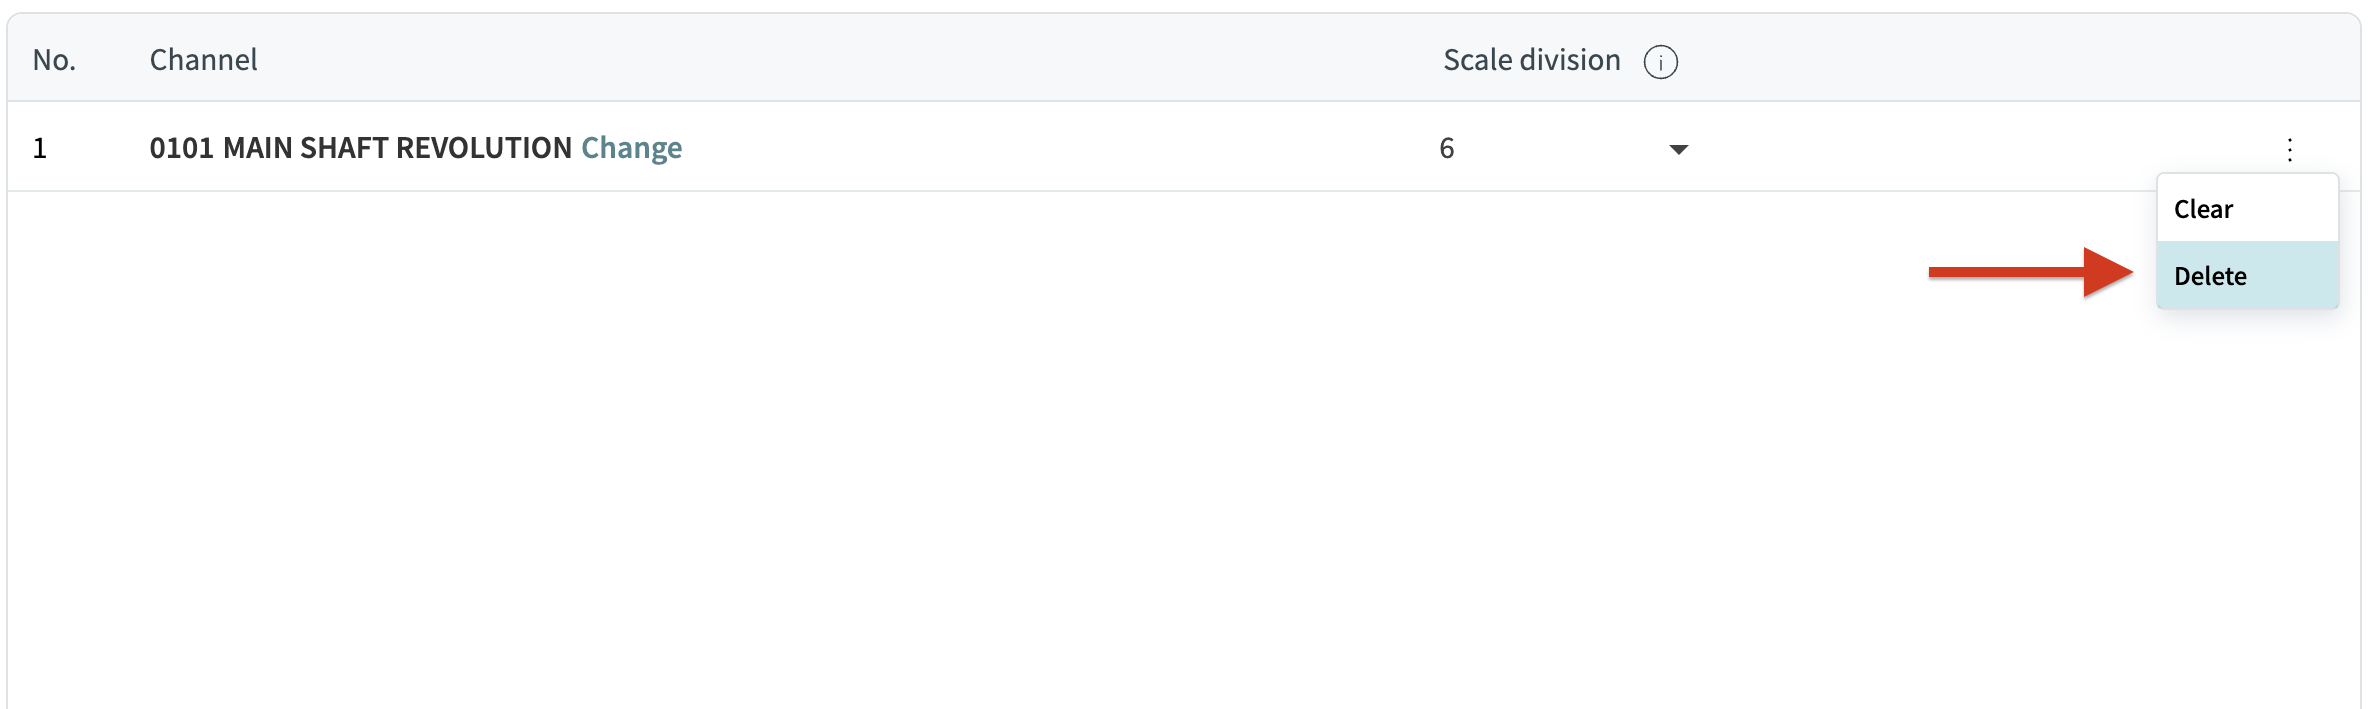
To delete a channel row from the graph, open the channel options menu and select Delete.
5. Exhaust Gas Graph Settings
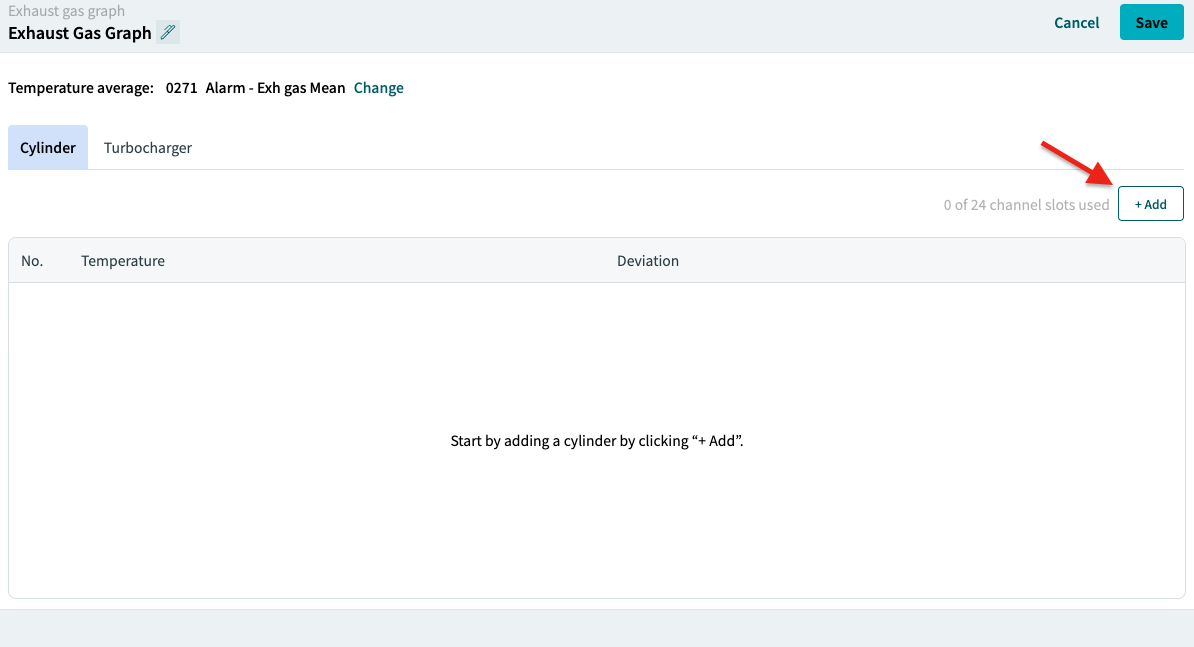
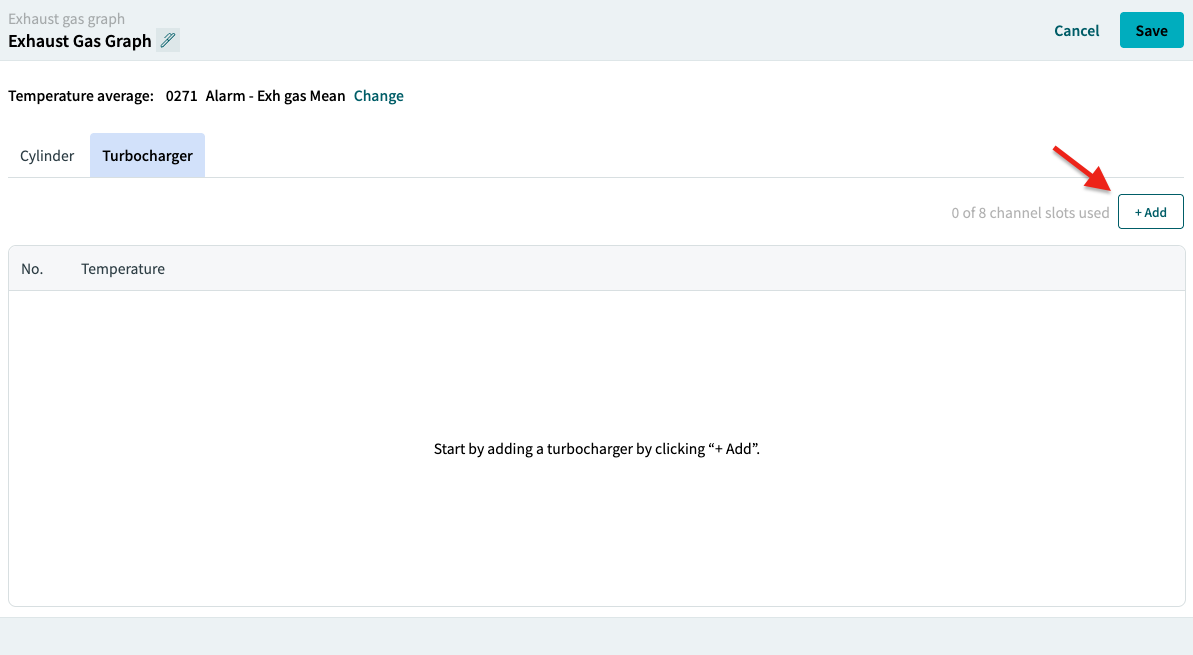
The Exhaust Gas graph provides temperature and deviation data for cylinders and turbochargers.
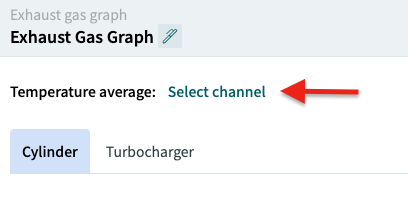
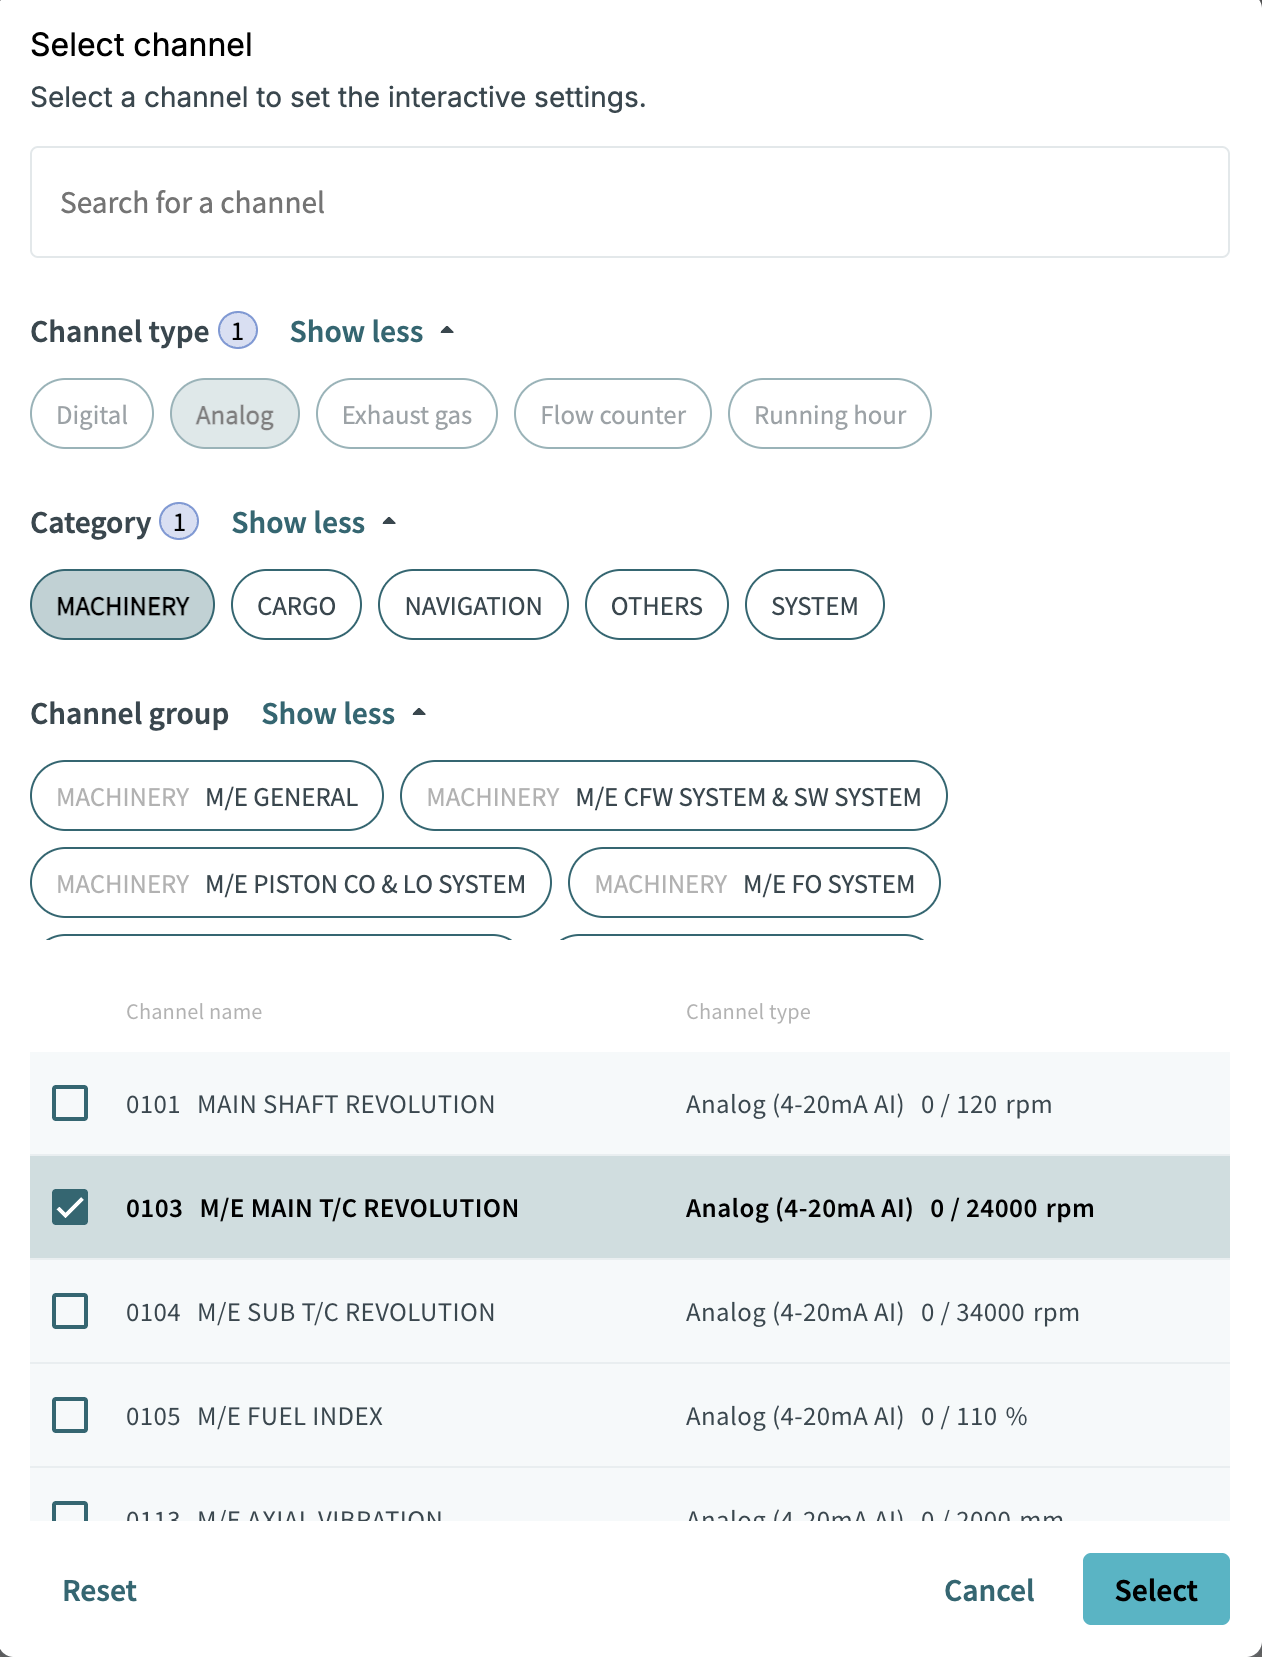
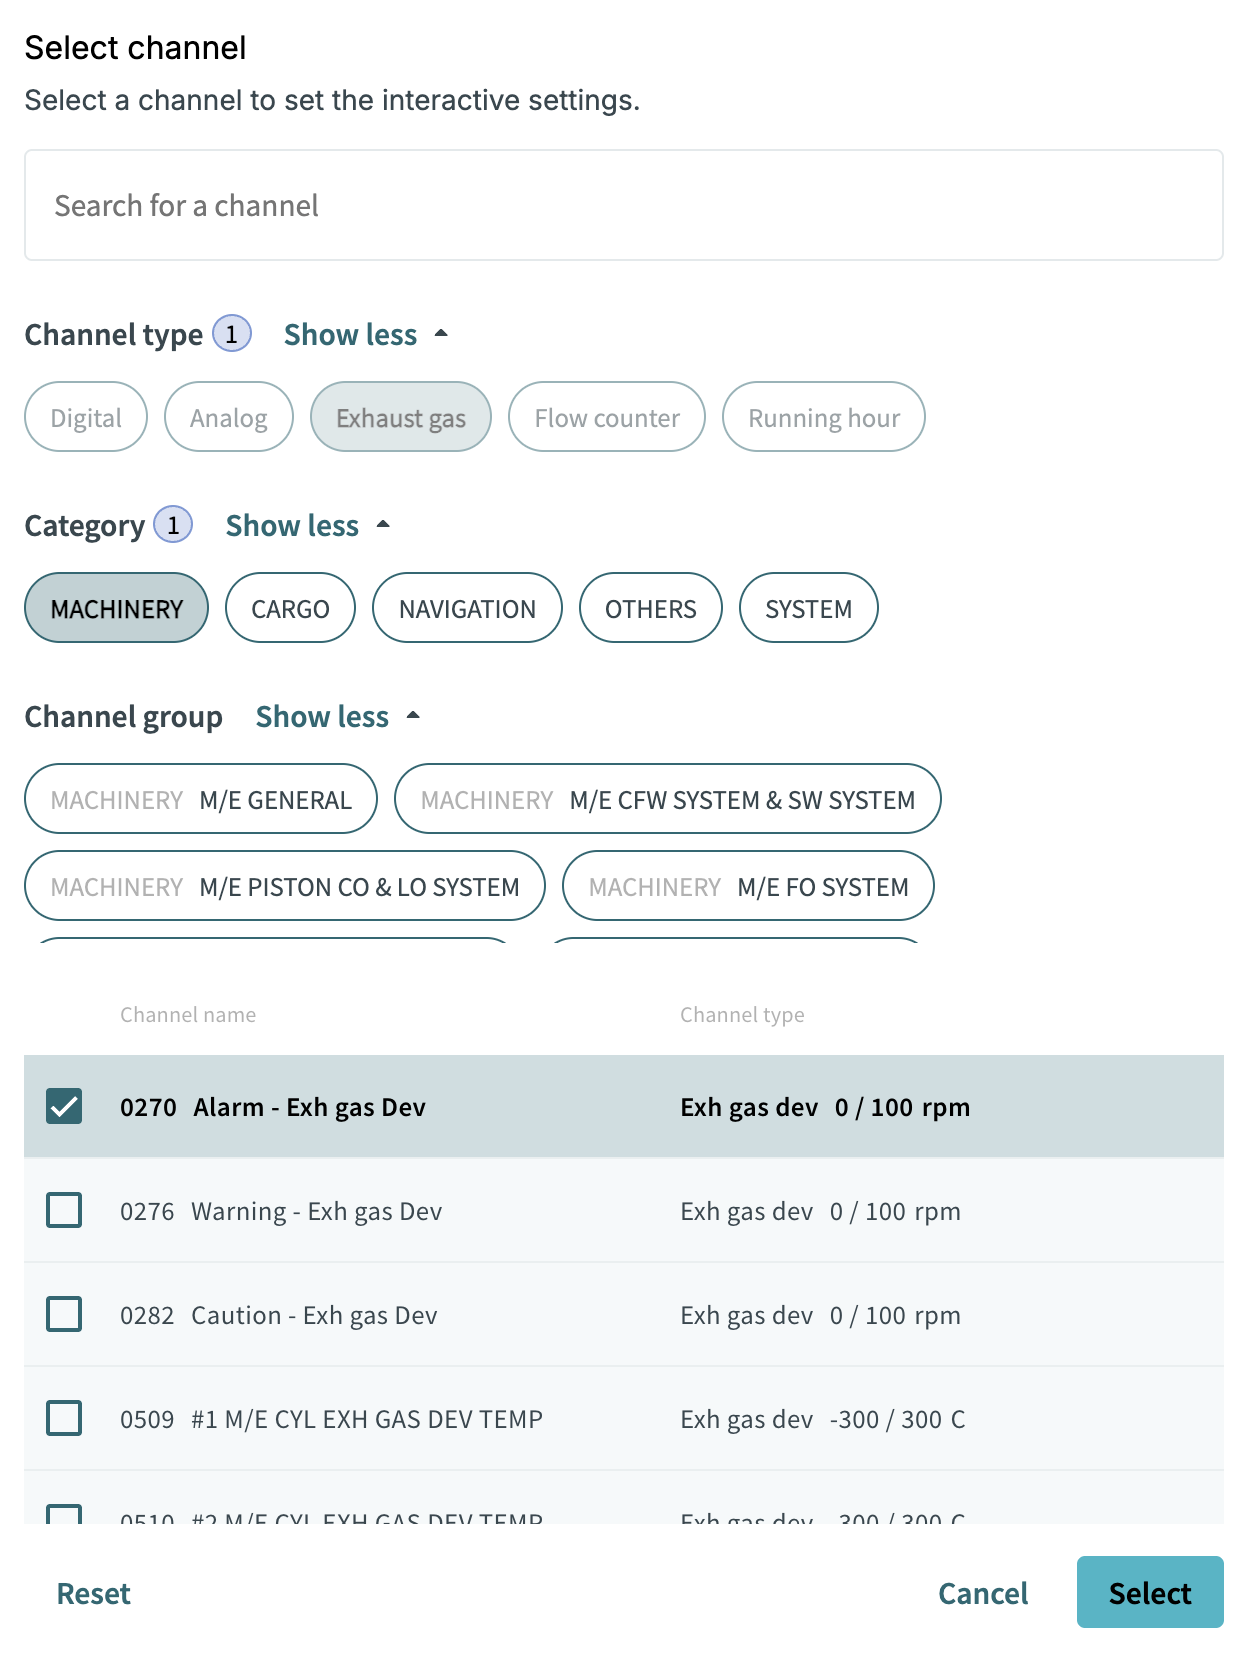
To configure the Exhaust Gas graph, first select a channel for the temperature average.
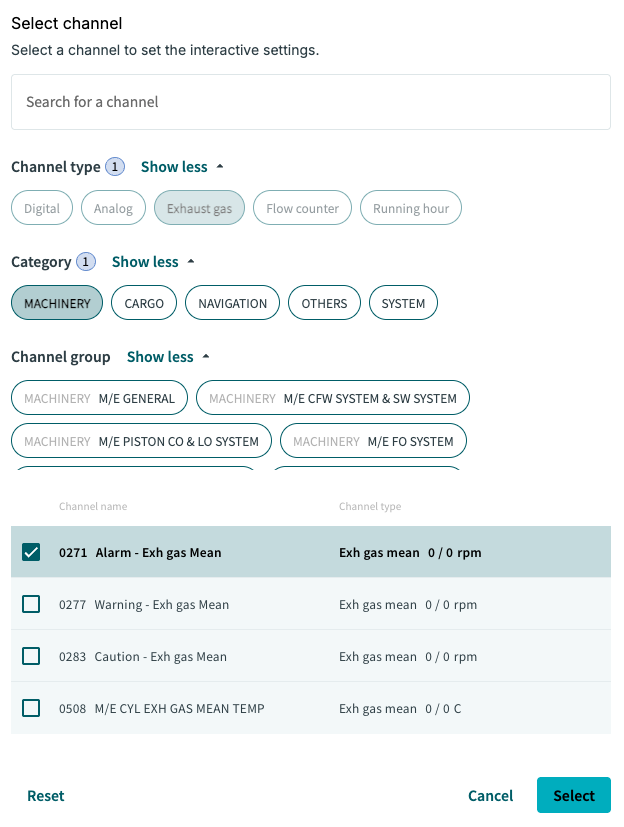
The temperature average channel must be an exhaust gas mean channel type.
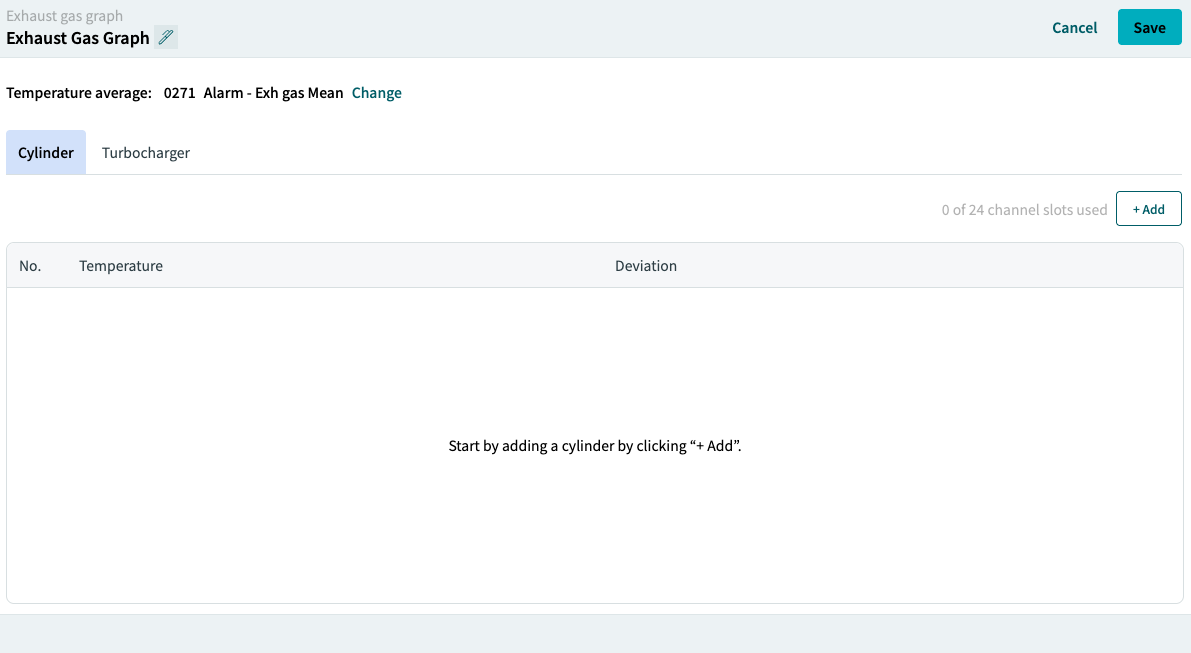
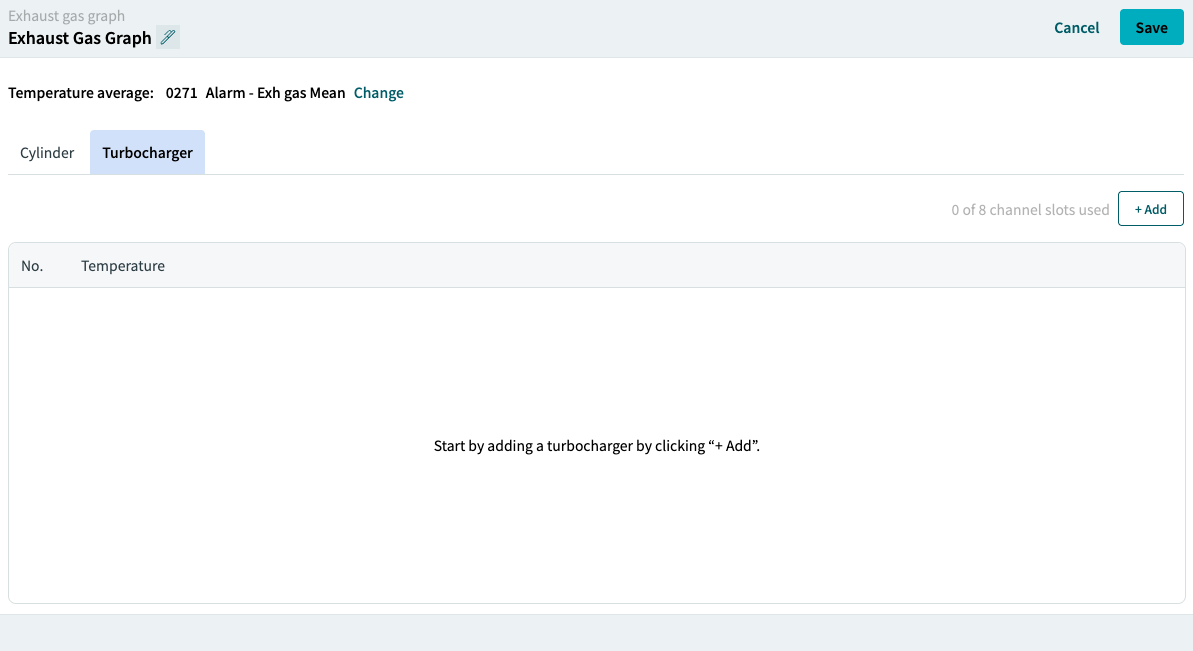
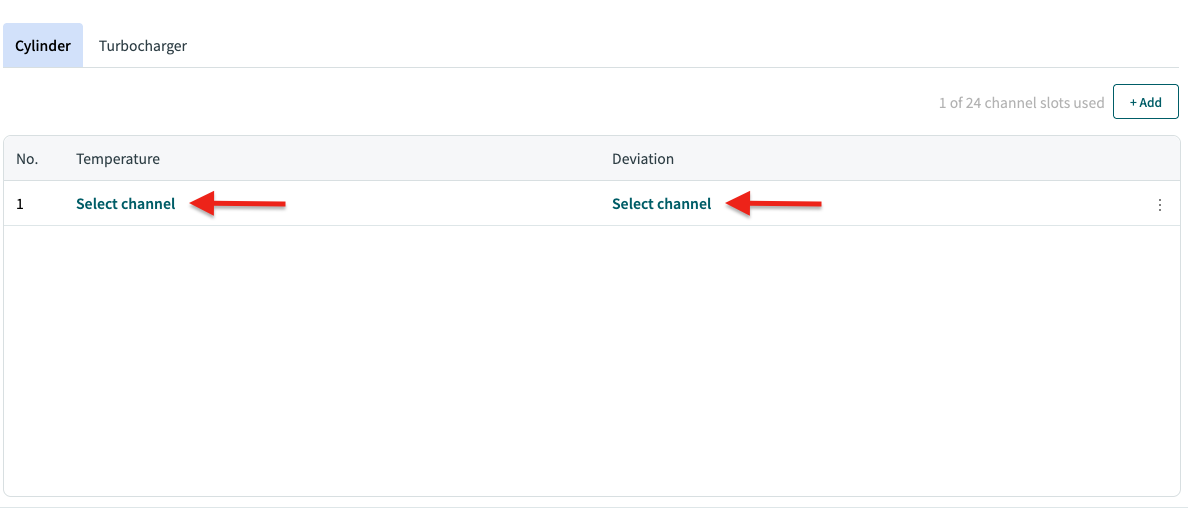
The Exhaust Gas graph contains two tabs, each with a separate table for configuring graph data:
-
Cylinder — Allows you to configure up to
24rows.
-
Turbocharger — Allows you to configure up to
8rows.

6. Manage Existing Graphs
Reorder Graphs
To change the order of the graphs, click and hold a graph row, then drag it to the desired position.
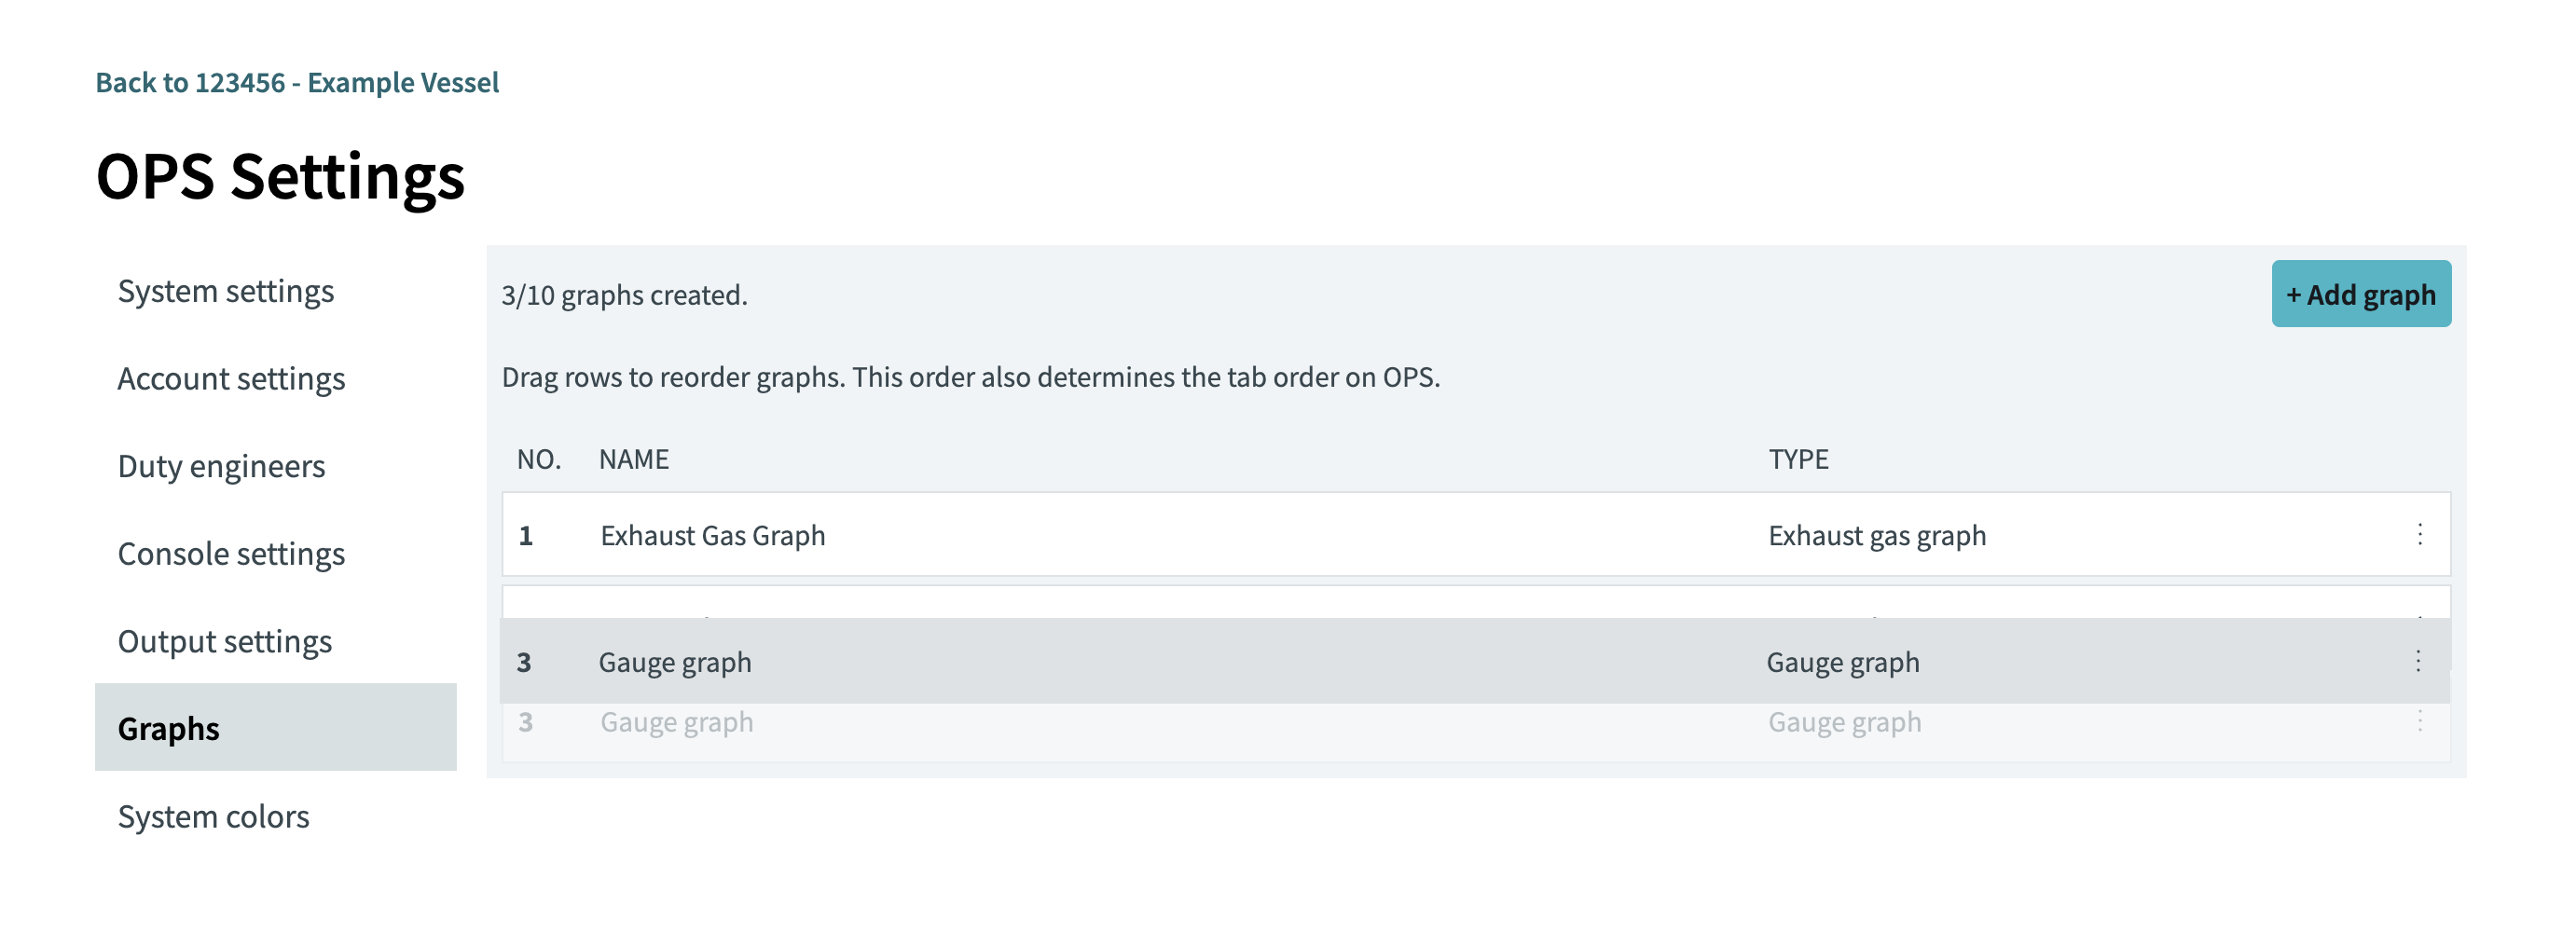
The graph list is reordered according to the new position of the row.
|
The order of the graphs also determines the tab order on OPS. |
Edit a Graph
Each graph provides an options menu that can be accessed by clicking the menu button (⋮) next to the graph.
From the graph options menu, select Edit.
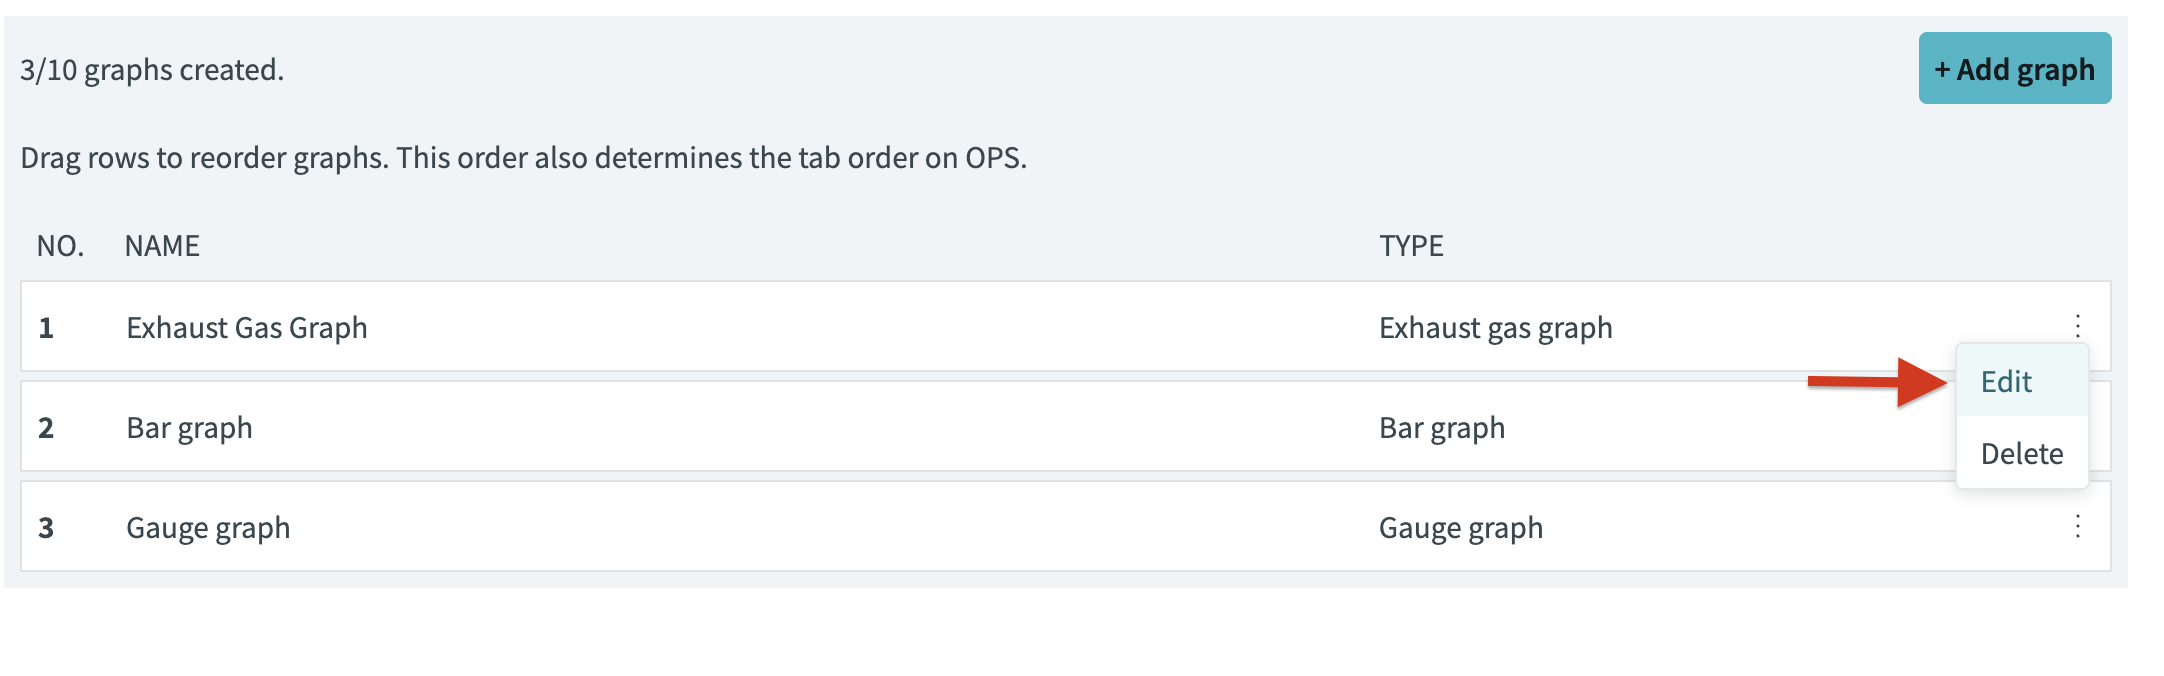
The "Edit graph" dialog is displayed.
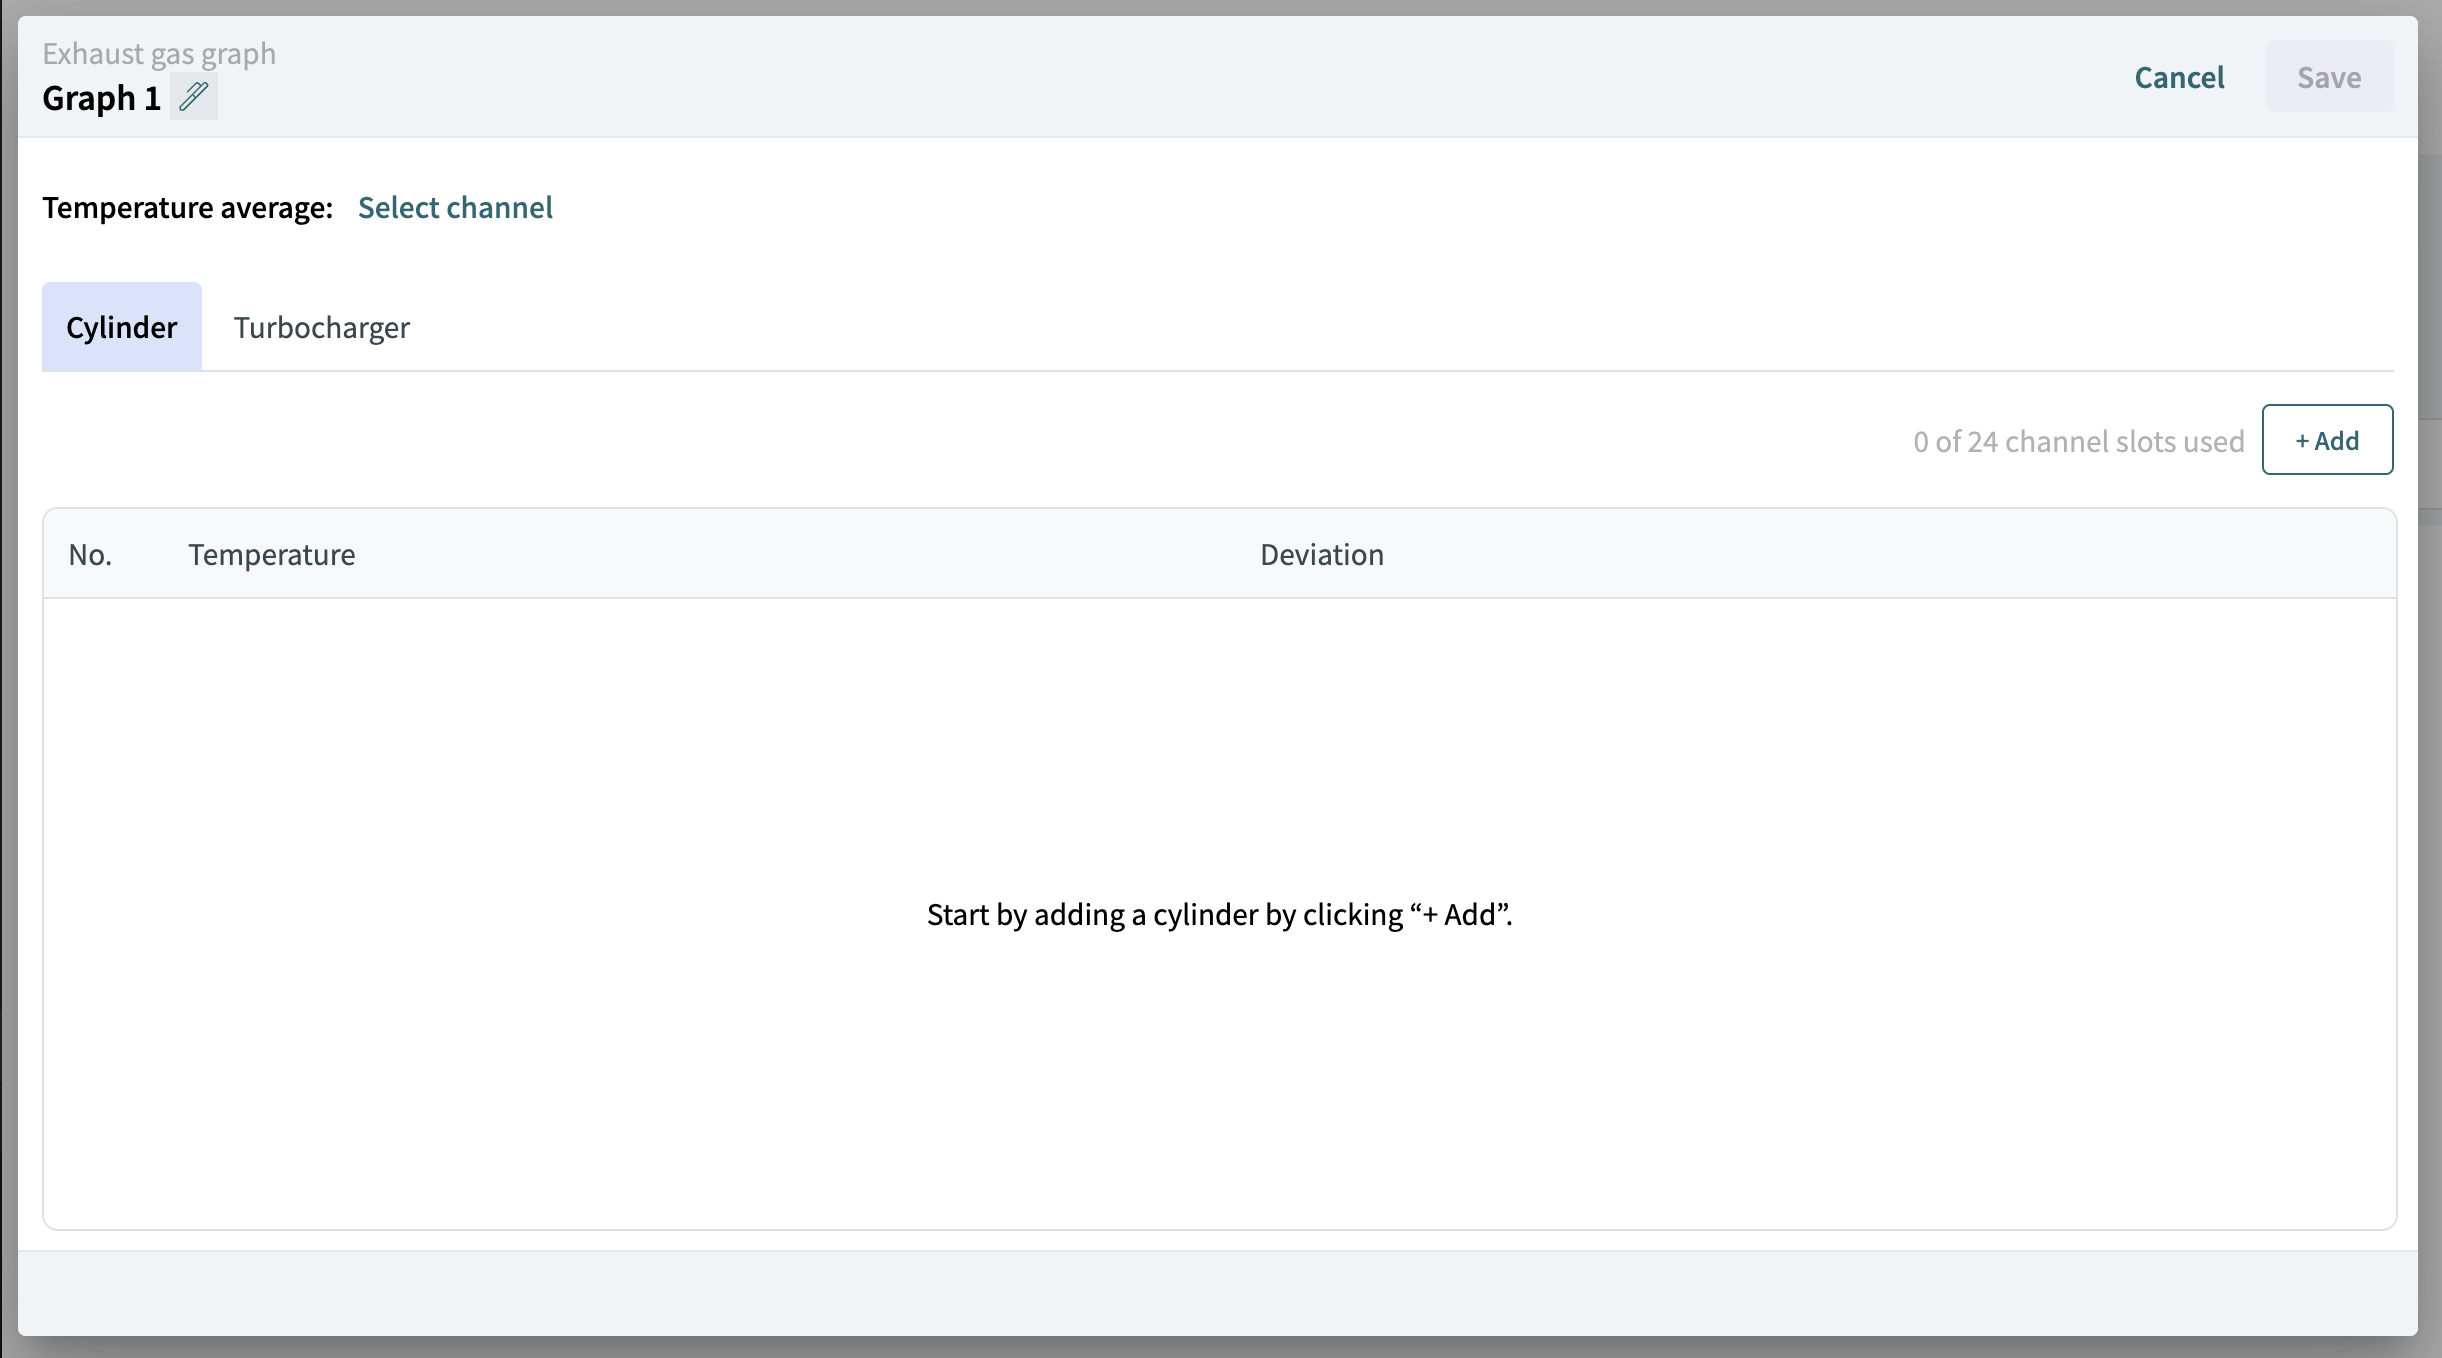
The "Edit graph" dialog contains the graph settings and additional settings for the graph.
To rename the graph, click the pen icon next to the graph name.
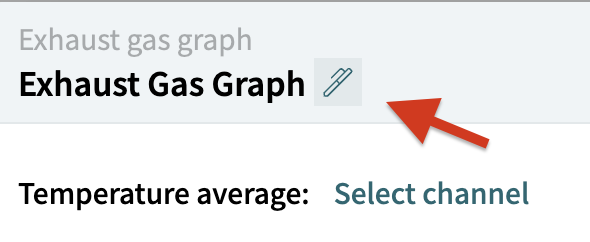
The "Edit graph name" dialog is displayed.
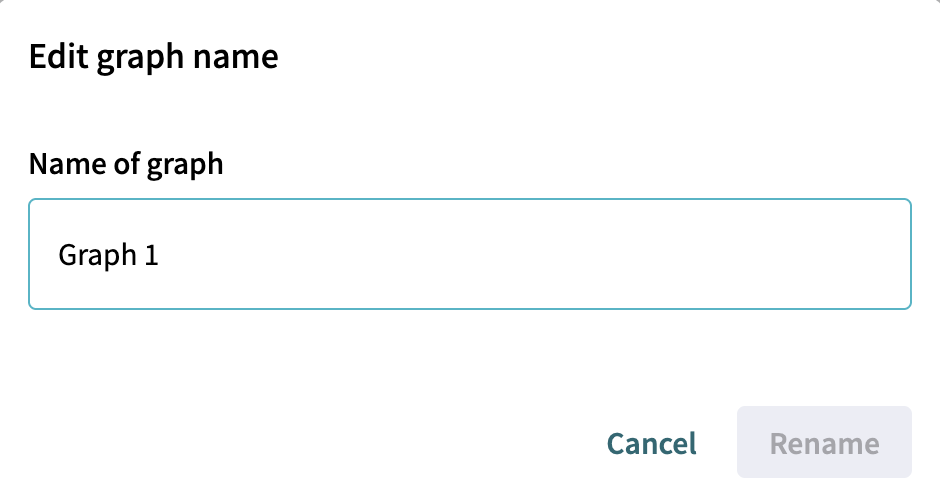
Enter a new name for the graph and click Rename.
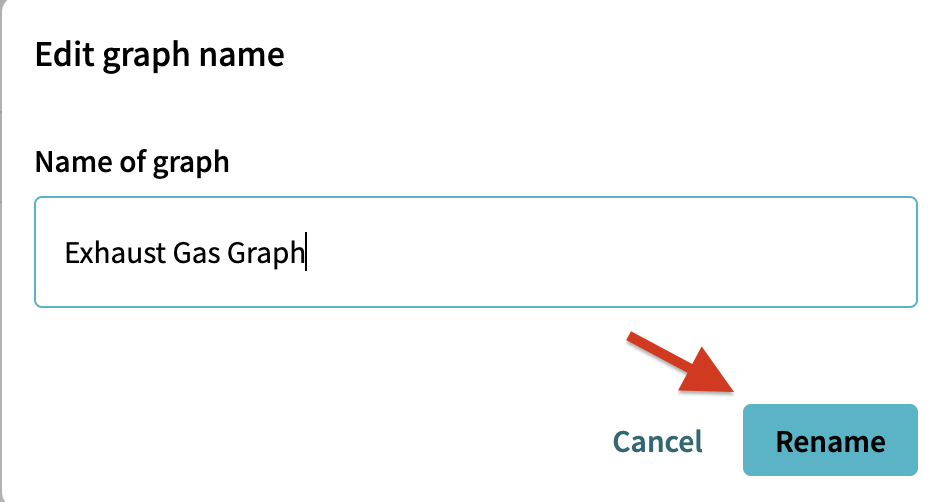
The new graph name is displayed in the edit graph dialog.
|
The graph name is not saved permanently until you click Save in the edit graph dialog. |
Make any other required changes to the graph settings.
To save the changes, click Save.

|
The Save button is enabled only when changes have been made to the graph settings or the graph name. |
To exit the edit graph dialog without saving changes, click Cancel.
If there are unsaved changes, the "Are you sure you want to exit without saving your changes?" confirmation dialog is displayed.
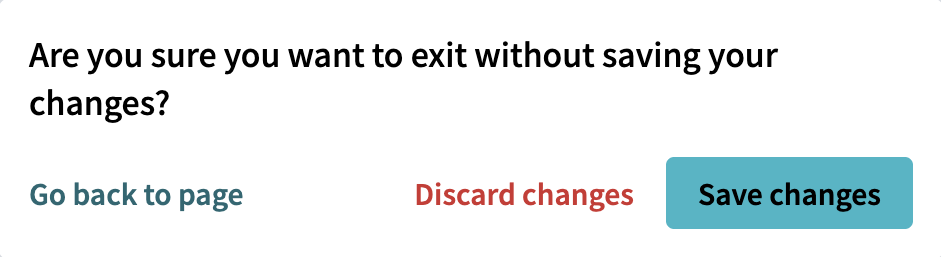
The following options are available:
-
Click Continue editing to return to the edit graph dialog and continue making changes.
-
Click Discard changes to discard the unsaved changes and exit the edit graph dialog.
-
Click Save changes to save the unsaved changes and exit the edit graph dialog.
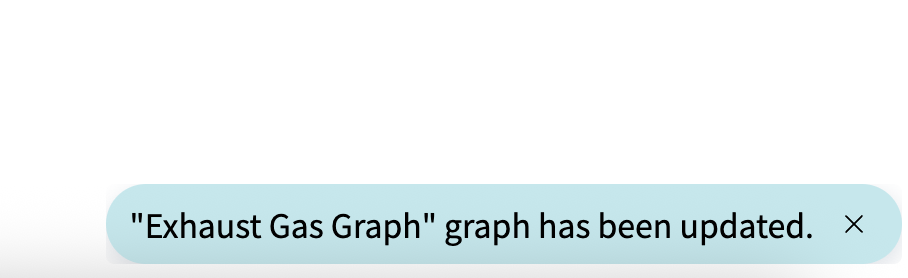
When the changes are saved using either Save or Save changes, a confirmation message is displayed in the bottom-right corner, and the updated graph settings are applied.
When Discard changes is selected, the unsaved changes are discarded and the edit graph dialog is closed.
Delete a Graph
From the graph options menu, select Delete.
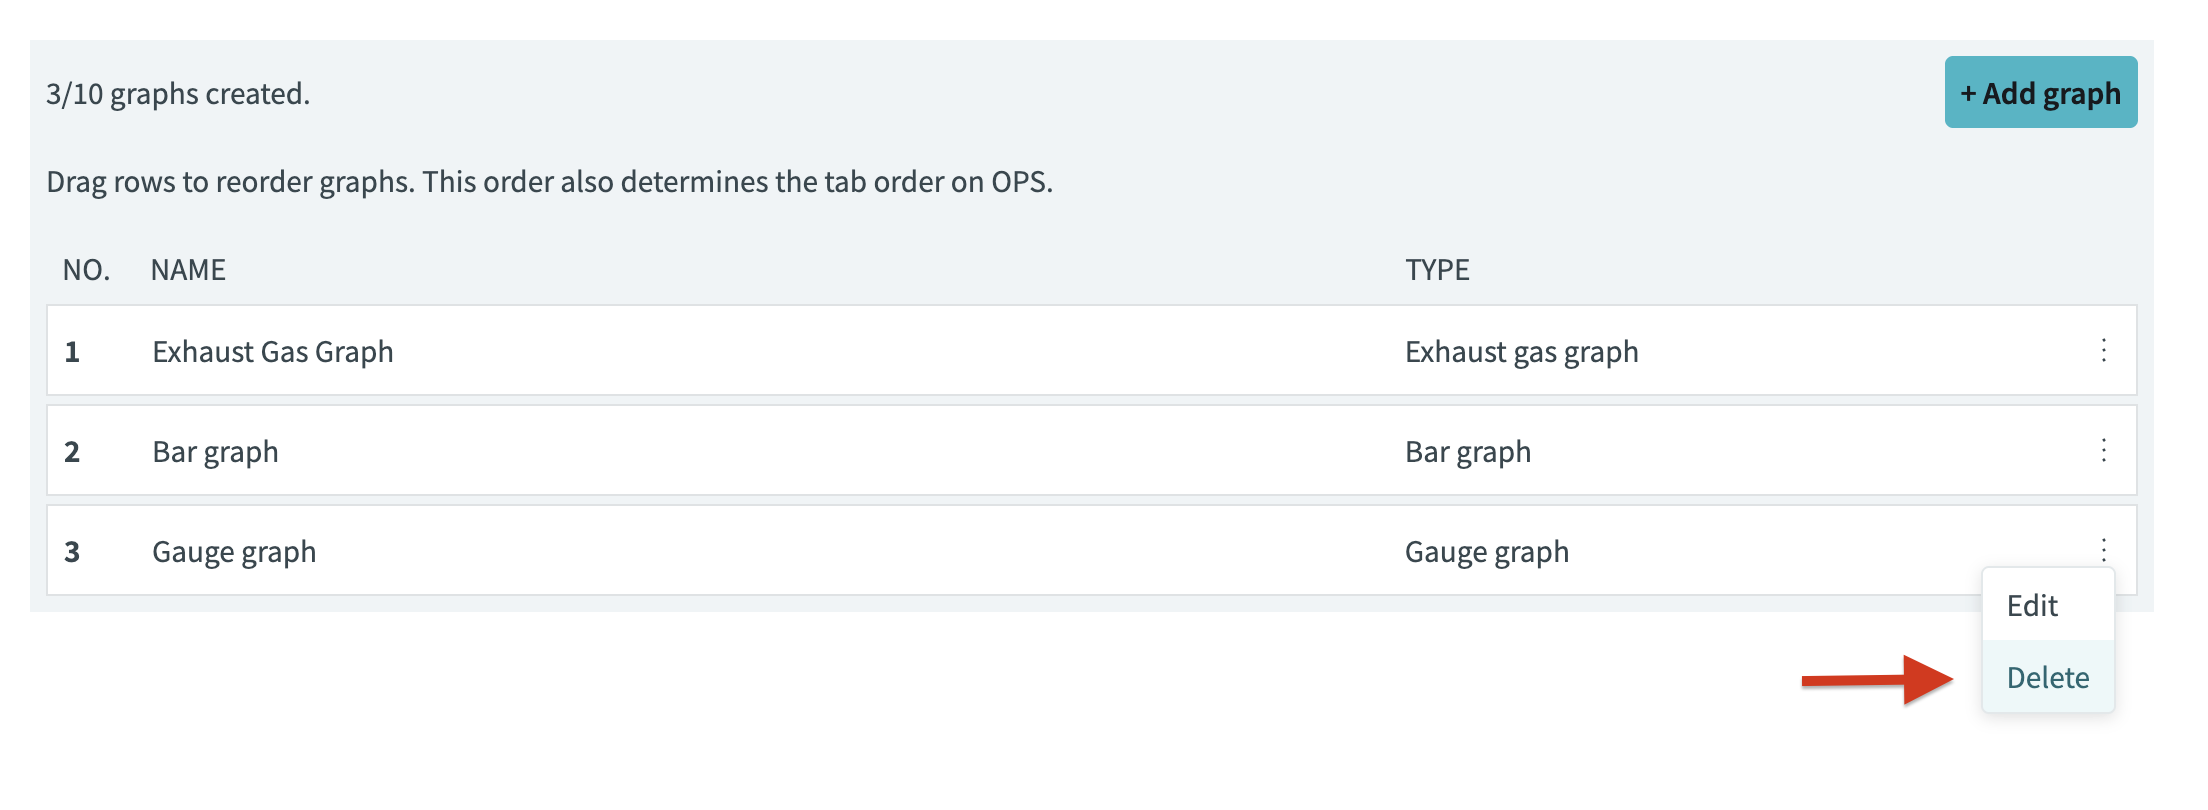
A confirmation dialog is displayed.
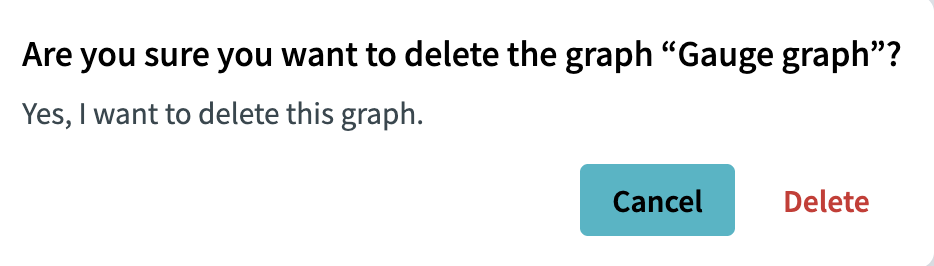
Click Cancel to close the dialog without deleting the graph.
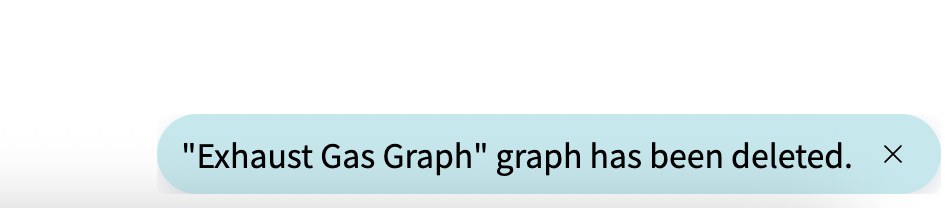
If you click Confirm, the graph is permanently deleted and removed from the graphs list. A confirmation message is displayed in the bottom-right corner.
|
Deleted graphs cannot be recovered directly. However, you can restore an earlier version from the cloud. The restored version contains the graphs and settings that were included in the most recent manual upload to the cloud. Changes made after that upload are not included. |
Verification
Confirm that the graph settings have been applied successfully.
-
Newly created graphs are displayed in the graphs list.
-
Updated graph settings are displayed correctly.
-
The graph order is reflected in the graphs list and the tab order on OPS.
-
Deleted graphs are removed from the graphs list.