
infoceanus connect registration
Create a Microsoft account and setup Microsoft Authenticator
-
Go to the official Microsoft page at https://account.microsoft.com/.
-
Click "Create a Microsoft account".
-
Enter your email address.
-
Please enter your company’s email address.
-
-
Enter an arbitrary password (at least 8 alphanumeric characters) and click "Next". *We recommend that you write down your password.
-
The Microsoft Account Team will send you a 4-digit security code to your email.
-
Enter the security code.
-
Enter the characters that appear in the image. This completes the creation of a Microsoft account.
-
Select "Security" on your microsoft account page and click Two-step verification.
-
Select Microsoft Authenticator as the verification method.
-
Download the Microsoft Authenticator app from the App Store or Google Play.
-
Open the app and tap "Add account".
-
Select "Work or school account".
-
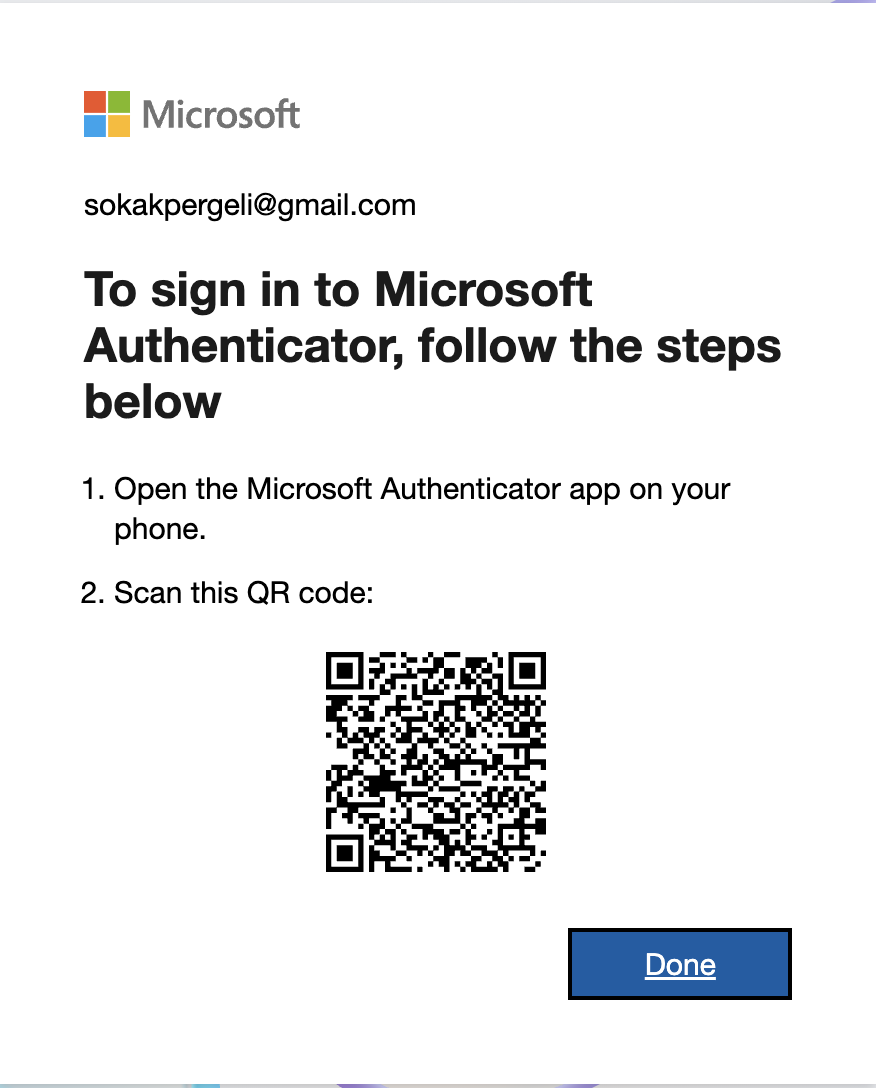
Use your phone’s camera to scan the QR code displayed on your computer screen.
User registration on infoceanus platform
In order to start using the service, we will ask you to contact us with your account information for the vessel and the user.
-
Vessel Name: ABC Maru (Ship building / SNo. / IMO No)
-
Account Information (E-mail Address): sample@abc.com
-
Your account must be registered with a Microsoft account.
-
How to start using infoceanus connect
After your account is registered, you will receive an email from Microsoft as in below: image::instruction_pics/emailreceived.png[Email received,width=600]
Please follow the instructions in the email to complete your registration by clicking infoceanus connect url: https://infoceanus.connect-jrcs.com/.
How to use Microsoft Authenticator for infoceanus connect
When you log in to infoceanus connect, you will be asked to verify your identity using the Microsoft Authenticator app.
-
Log in to the Connect app image::instruction_pics/loginpicture.png[login,width=600]
-
Sign in to you microsoft account image::instruction_pics/microsoftlogin.png[Microsoft login,width=600]
-
Set up your Microsoft Authenticator app
-
If you have not set up the Microsoft Authenticator app, you will be prompted to do so. image::instruction_pics/authsetup.png[Authenticator Setup,width=600]
-
-
Use your phone’s camera to scan the QR code displayed on your computer screen. image::instruction_pics/qraccount.png[QR code,width=600]
-
Complete authenticator setup image::instruction_pics/authcomplete.png[Authenticator Complete,width=600] image::instruction_pics/authcompletenotif.png[Authenticator Notification,width=600]
-
On your mobile device, open Authenticator, or tap the New sign-in request notification.
-
Note: If you’re a work or school account user, you may need to unlock Authenticator before confirming sign-in.
-
-
Tap or enter the corresponding number, then Approve. image::instruction_pics/numbermatching.png[Number matching,width=600]
Terms & Conditions
The launch the infoceanus connect application, open the following URL in your browser:
The supported browsers are the following: ① Microsoft Edge ② Google Chrome ③ Apple Safari
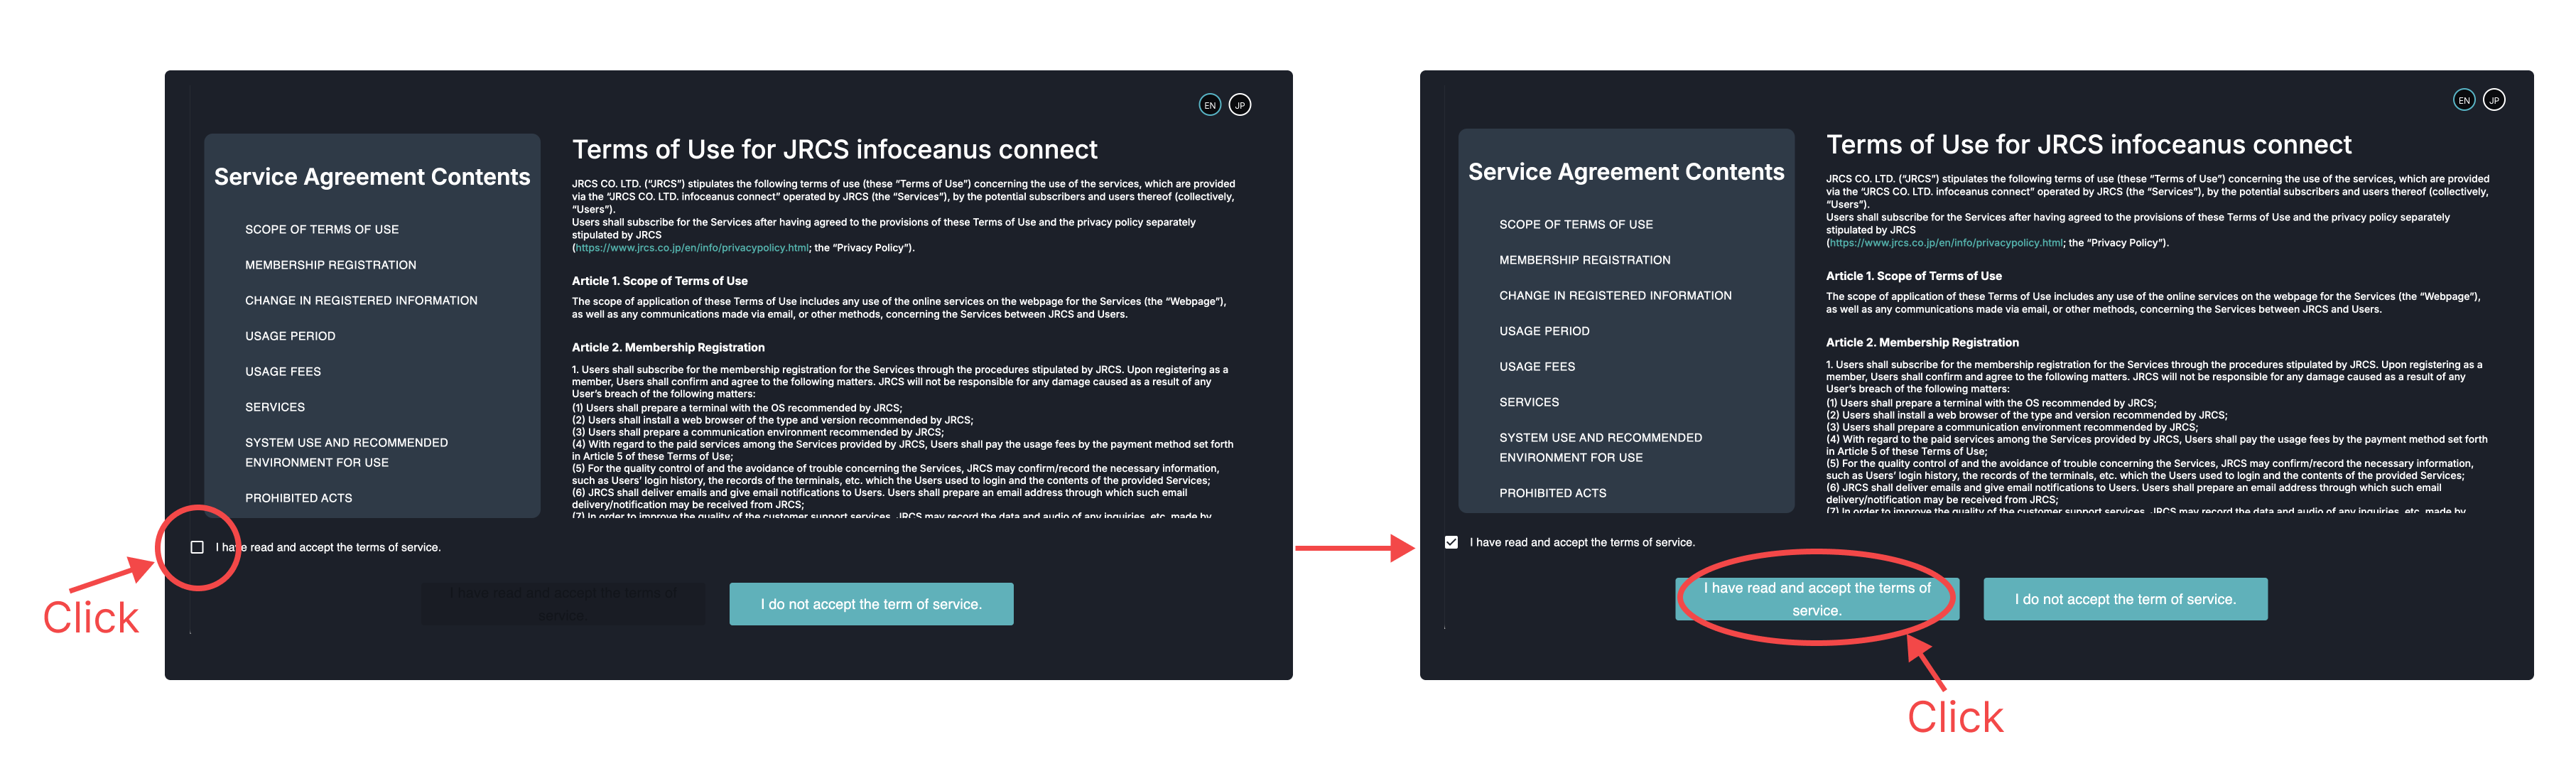
The first time you open the URL, you will be asked to accept the terms of use. Scroll down to the end of the screen and check the checkbox of “I accept the terms of use”, and then click the button “I accept the terms of use”. If you have already accepted the terms of use, you will be redirected to fleet monitoring page.
Top Bar
All infoceanus connect pages have a common top bar for navigation.

On the left side of the top bar, the name of the current screen and the vessel selection can be found. Clicking on the vessel selection shows a dropdown menu with all available vessels. Click to select a vessel.
(PICTURE)
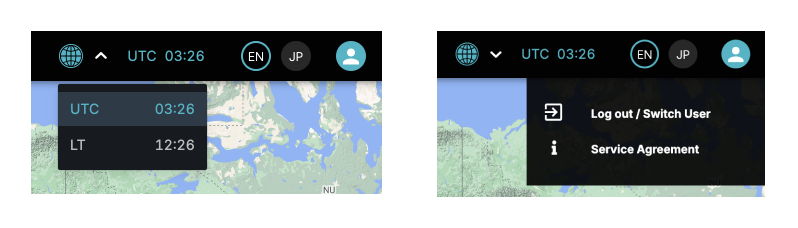
The right side of the top bar displays the current date and time (UTC: Universal Standard Time and LT: Local Time). You can switch between English language and Japanese language by clicking on the EN and JP buttons. The circled button is the active language. Clicking on the user profile icon lets you switch or log out as well as show the terms of conditions.
Fleet Overview Screen
After the login, the fleet overview page shows the vessels related to the users affiliation in the map as well as in list from on the left side.
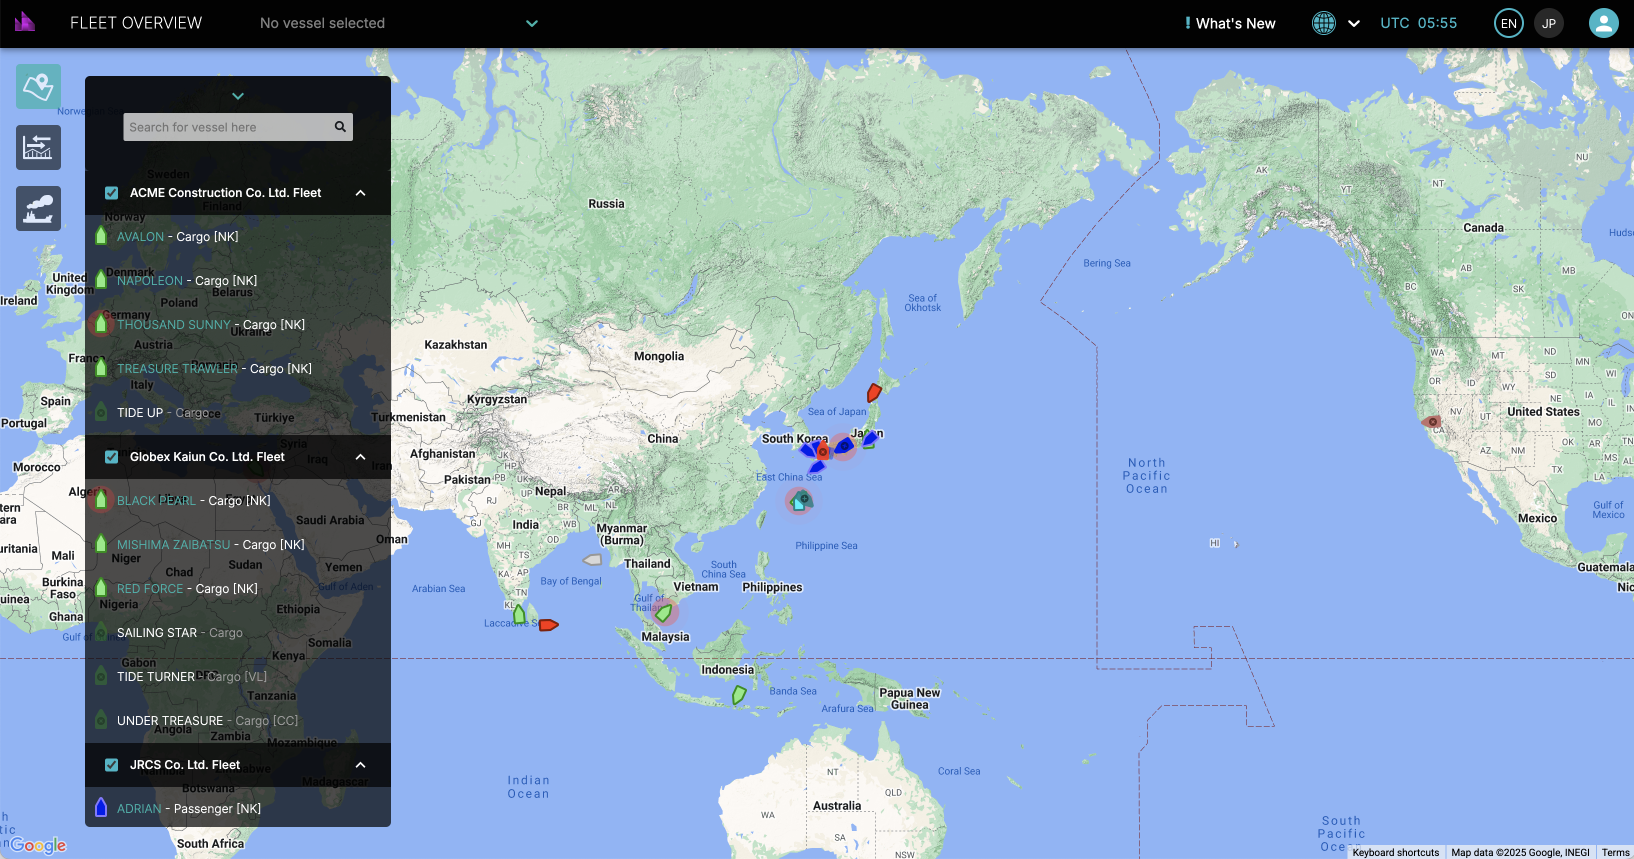
There are 3 ways to select a vessel.
-
You can click the drop down from the top menu to display the vessel list and select a specific vessel by clicking on it. (Search and select by name)
-
Select the target vessel by clicking on it via the displayed vessel list on the screen. (Search and select by name)
-
Click on the vessel icon on the map. (Search and select by location)
(PICTURE)
The displayed vessel list features the otion to select vessel sorted by companies. You can open and close certain companies to not display the vessels in the list. Vessels from selected companies (only closed via the arrow, checkbox is selected), are still shown on the map.
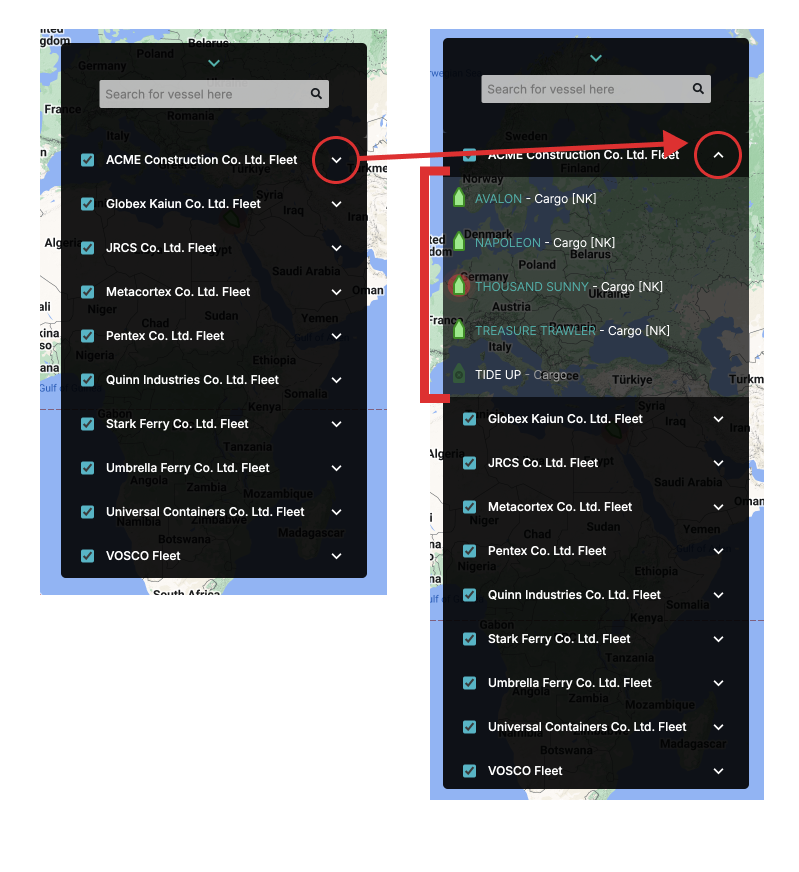
Deselecting the company checkbox will hide all vessels from that specific company from the map.
A vessel that is shown greyed out with a little (x) in the middle is currently offline and cannot be reached.
Vessels on the map and icon meanings
Vessels are represented by pentagon shaped icons on the map. Their sharpest point is the front/bow of the vessel and shows the direction of heading.

The colors of the vessel categories are defined as follows:
| Icon Color | Vessel Category |
|---|---|
green |
Cargo Vessels |
red |
Tankers |
blue |
Passenger Vessels |
yellow |
High Speed Craft |
light blue |
Tug & Special Craft |
orange |
Fishing |
pink |
Pleasure Craft |
grey |
Unspecified Ships |
When selecting a vessel, a quick summary of vessel information will be displayed on the side of the screen.
| Display information | Content |
|---|---|
Vessel picture |
Photo of the target ship |
Vessel’s flag |
Region of the ship |
Vessel name |
Name of the vessel |
IMO No. |
International Maritime Organization Registration Number |
Vessel type |
Type of vessel |
Call sign |
Vessel’s signal letters |
MMSI No. |
Maritime Mobile Service Identification Number |
Ship Class |
International class given by classification societies |
Destination |
Current destination |
Estimated time of arrival |
Estimated time of arrival at destination |
Ship speed |
Current ship speed over the ground |
Ship position |
Current position (latitude, longitude) |
True wind speed |
True wind speed at current position |
True wind direction |
True wind direction at current position |
Local time |
Local time at current position |
Local weather |
Weather and temperature at current position |
Sea water temperature |
Sea water temperature at current position |
Main engine basic data |
Main engine load, RPM, fuel consumption, and auxiliary engine fuel consumption |
Alarm data |
Number of active and paused alarms |
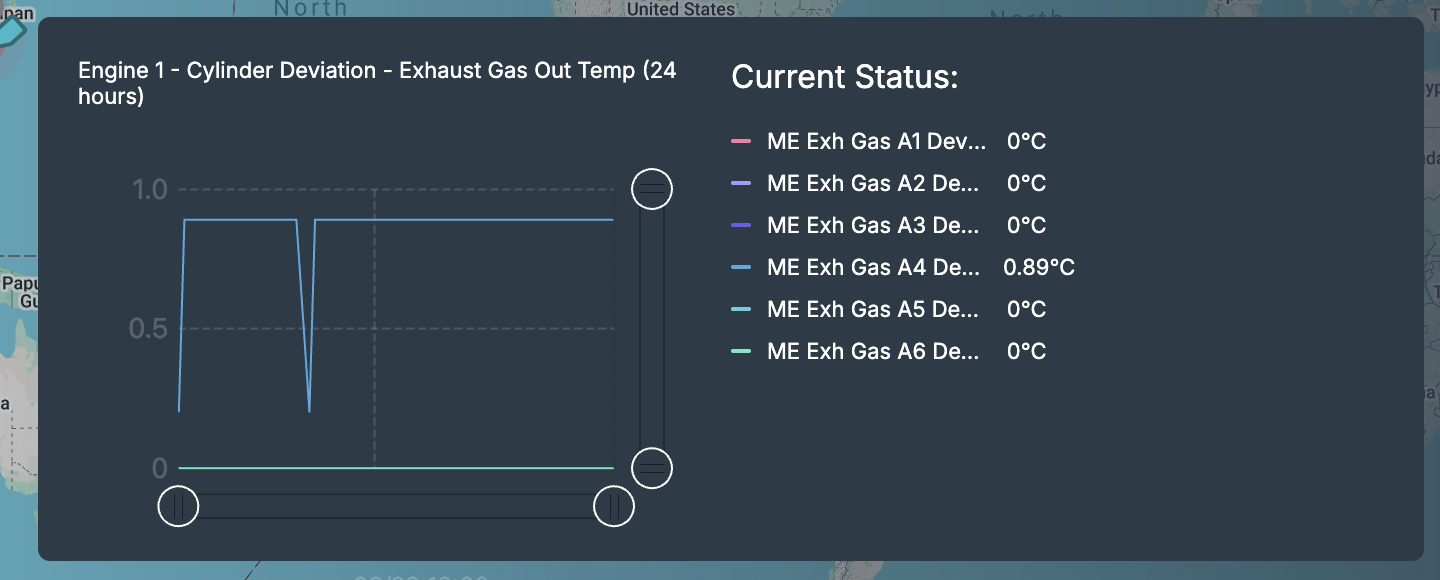
Cylinder deviation, exhaust gas temperature (※1) |
Exhaust gas temperature deviation of main engine cylinder: 24h numerical and graphical display |
Generators (※1) |
Power, load %, and operating time |
※1) Generally, the above items are displayed, but the displayed information may differ depending on the type of ship.
Vessel Overview
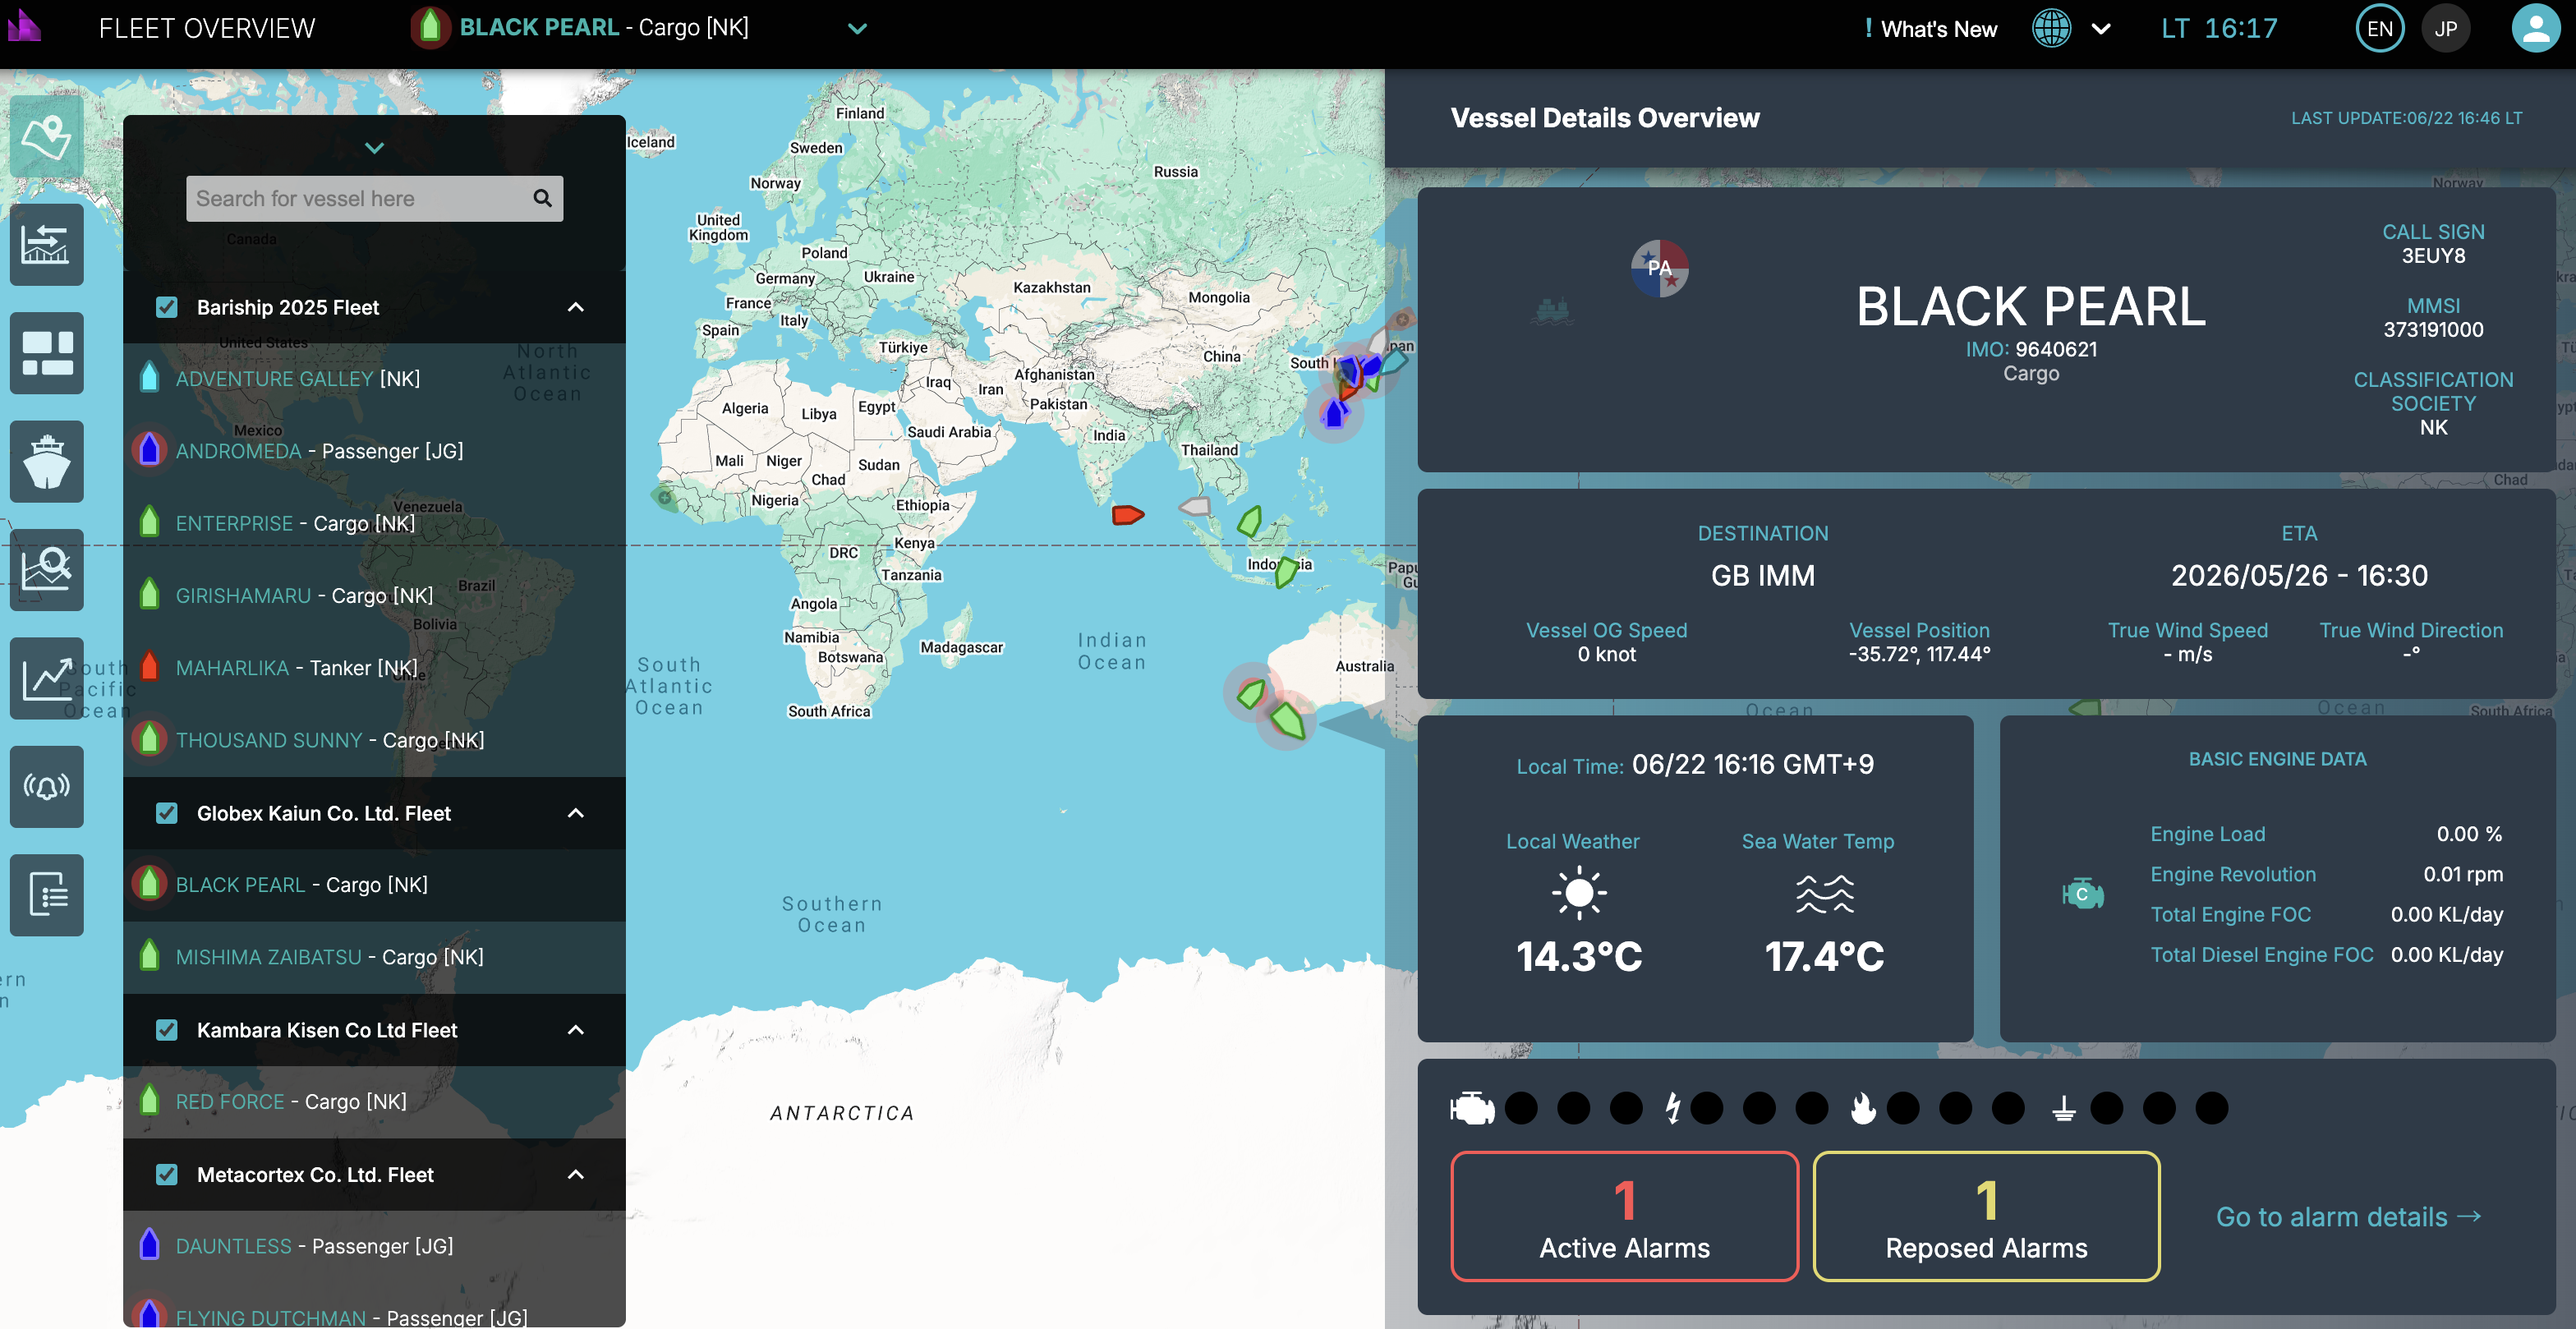
When you click a vessel on the Fleet Map or from the vessel list, the Vessel Overview panel opens. This gives a focused summary of the vessel and quick access to operational tools.
-
Header: Displays vessel name, MMSI/IMO, call sign, flag, and an optional photo or icon.
-
Position & Movement: Latest latitude/longitude, speed over ground (SOG), True Wind Speed, True Wind Direction, and destination/ETA if available from AIS.
-
Time & Weather: Local time, Local Weather and Sea Water Temperature.
-
Basic Engine Data: Key telemetry KPIs (engine load, RPM, total fuel oil consumption, Total Diesel Engine fuel oil consumption).
-
Alarms Quick Access: Display number of active and reposed alarms with their color code and category. Click
Go To Alarms Detailsto quickly access Alarm page. -
Engine trend: Display Engine Cylinder Deviation - Exhaust Gas temperatures.
-
Monitoring: Monitor Main Engine Load, Main Engine Power Curve and generator power, load and runtime.
Use the Overview as the starting point for critical vessel data.
Left-side Menu — Page Details
The left-side menu contains the main application pages. Below are details and common workflows for each.
Comparison Page
-
Purpose: Side-by-side comparison of vessels or channels to analyze differences and correlations (e.g., fuel consumption vs speed across two vessels).
-
Key features: Select 2–4 vessels or channels, pick a time range.
-
Output: An exportable comparison data.
Custom Dashboards
-
Purpose: Create personal or team dashboards tailored to workflows.
-
Features: Create, edit, arrange panels.
-
Sharing: Save as a personal dashboard or publish as a system dashboard, set view/edit permissions.
Dashboard Basics
-
Open Dashboards: Click Dashboards in the left nav. A list of available dashboards appears, including system dashboards and ones shared by your team.
-
Create a new dashboard: Click the
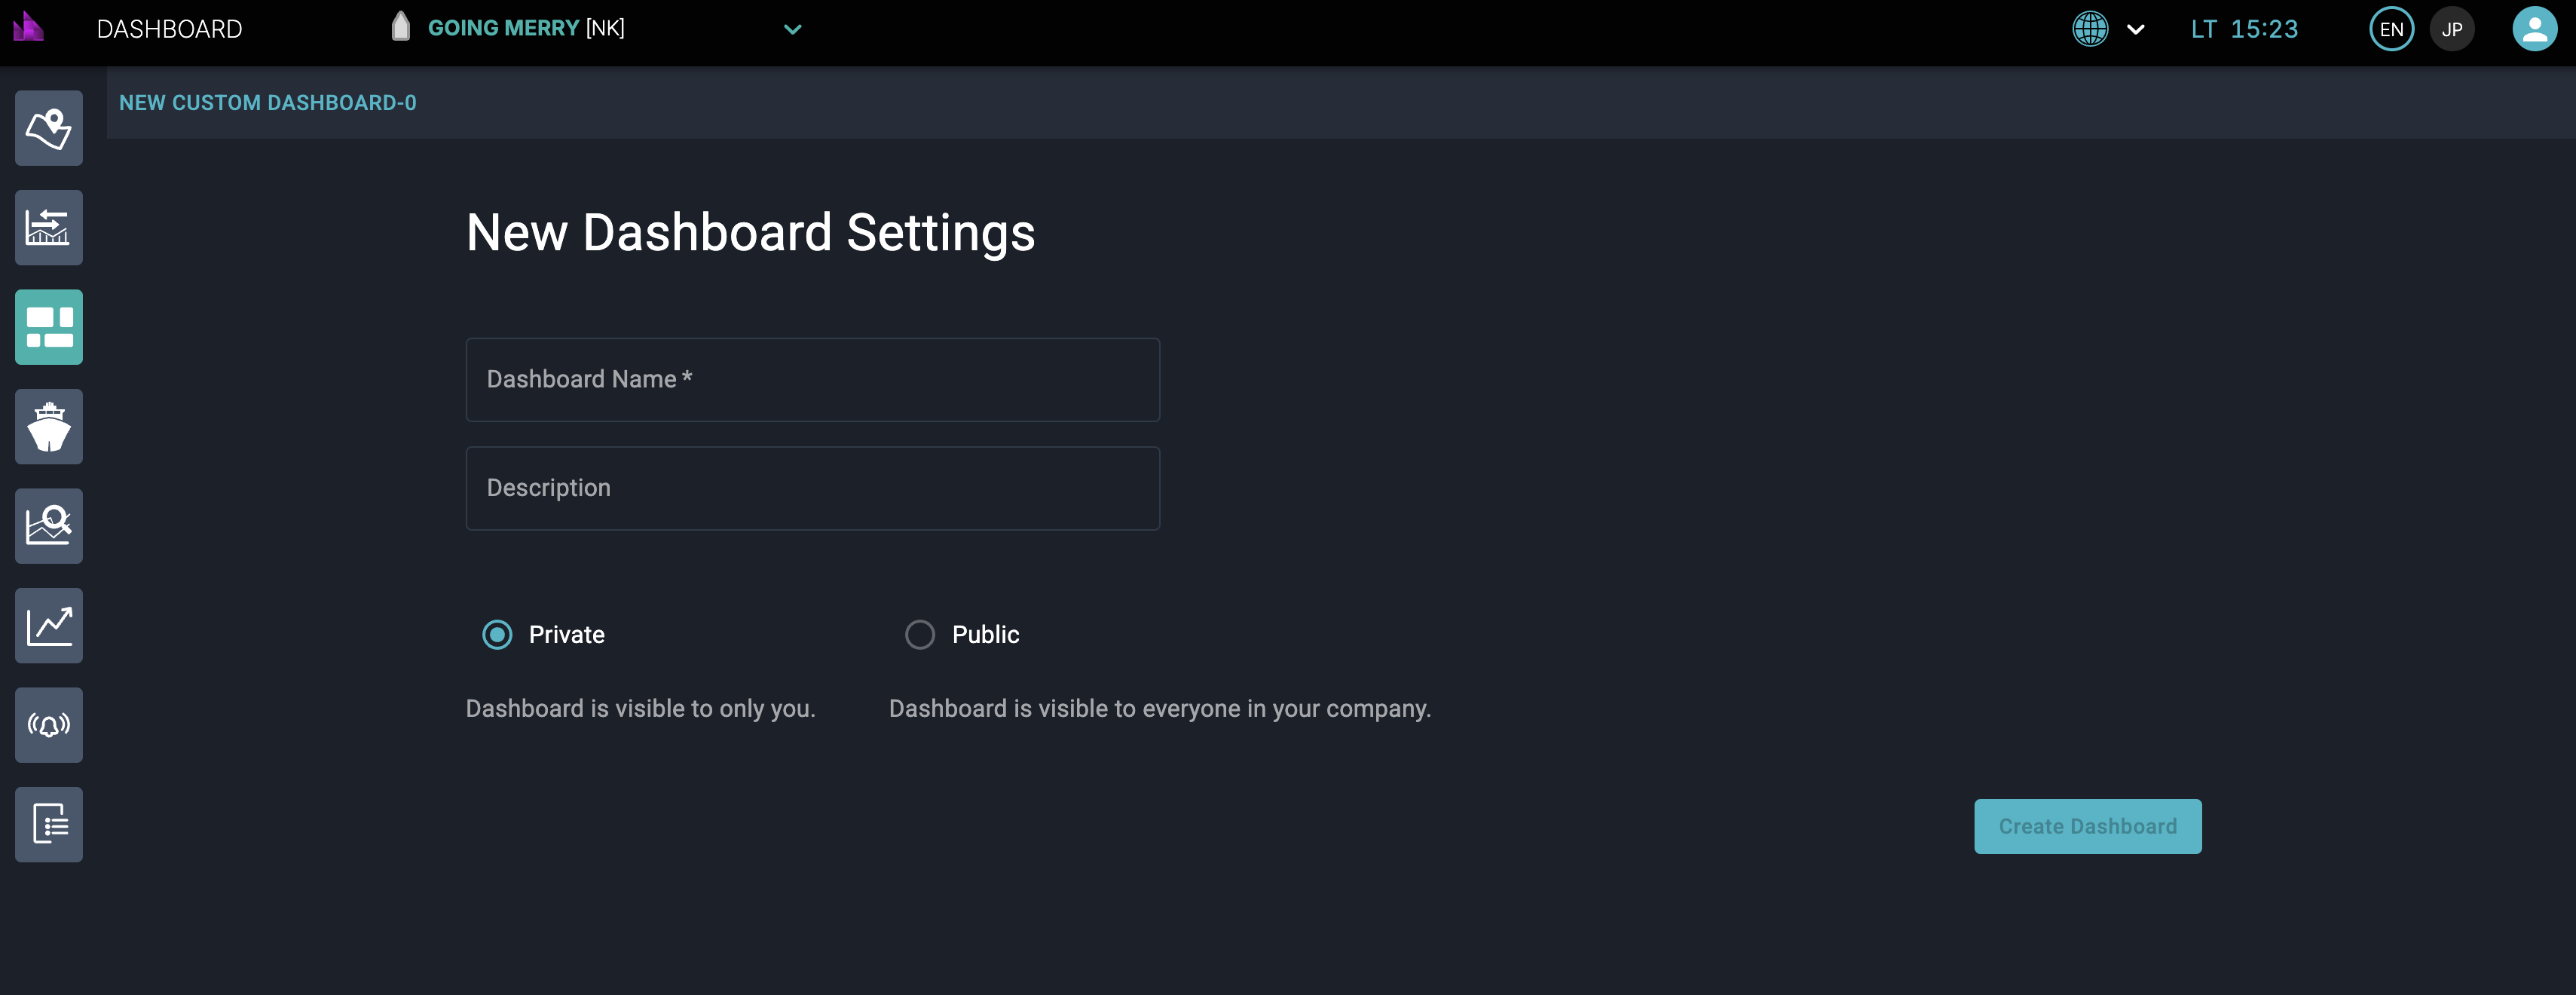
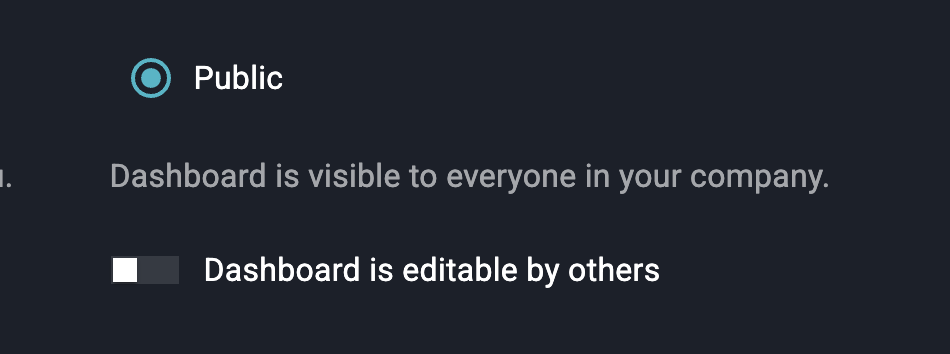
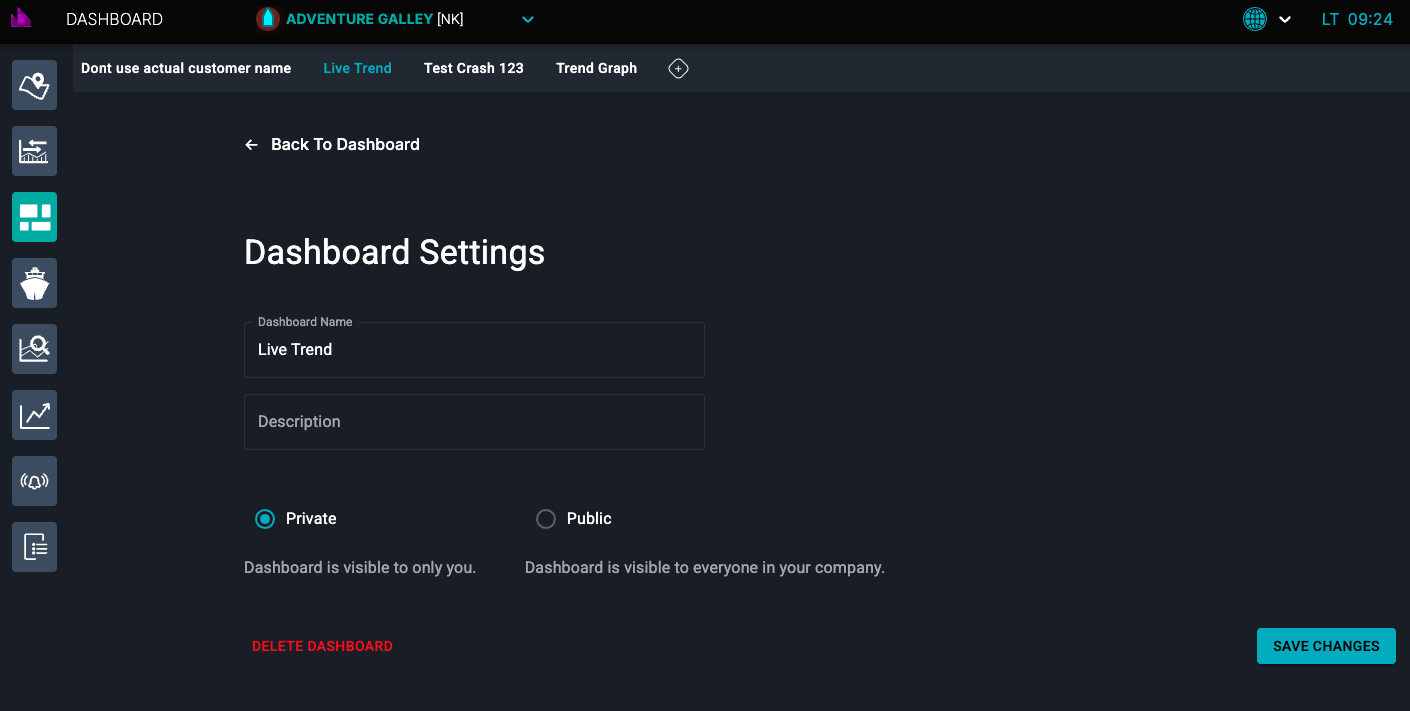
+ New Dashboardbutton, enter a name and optional description, choose whether dashboard will private or public then clickCreate Dashboard. Please note that Private dashboard can be viewed only by the user who created it. Public dashboard can be viewed by all users. If "Public" option is selected, then it is possible to enable ""Dashboard is editable by others"" option so that other can edit this dashboard.
-
add a new dashboard: It is possible to add up to 8 dashboard using
+button.
-
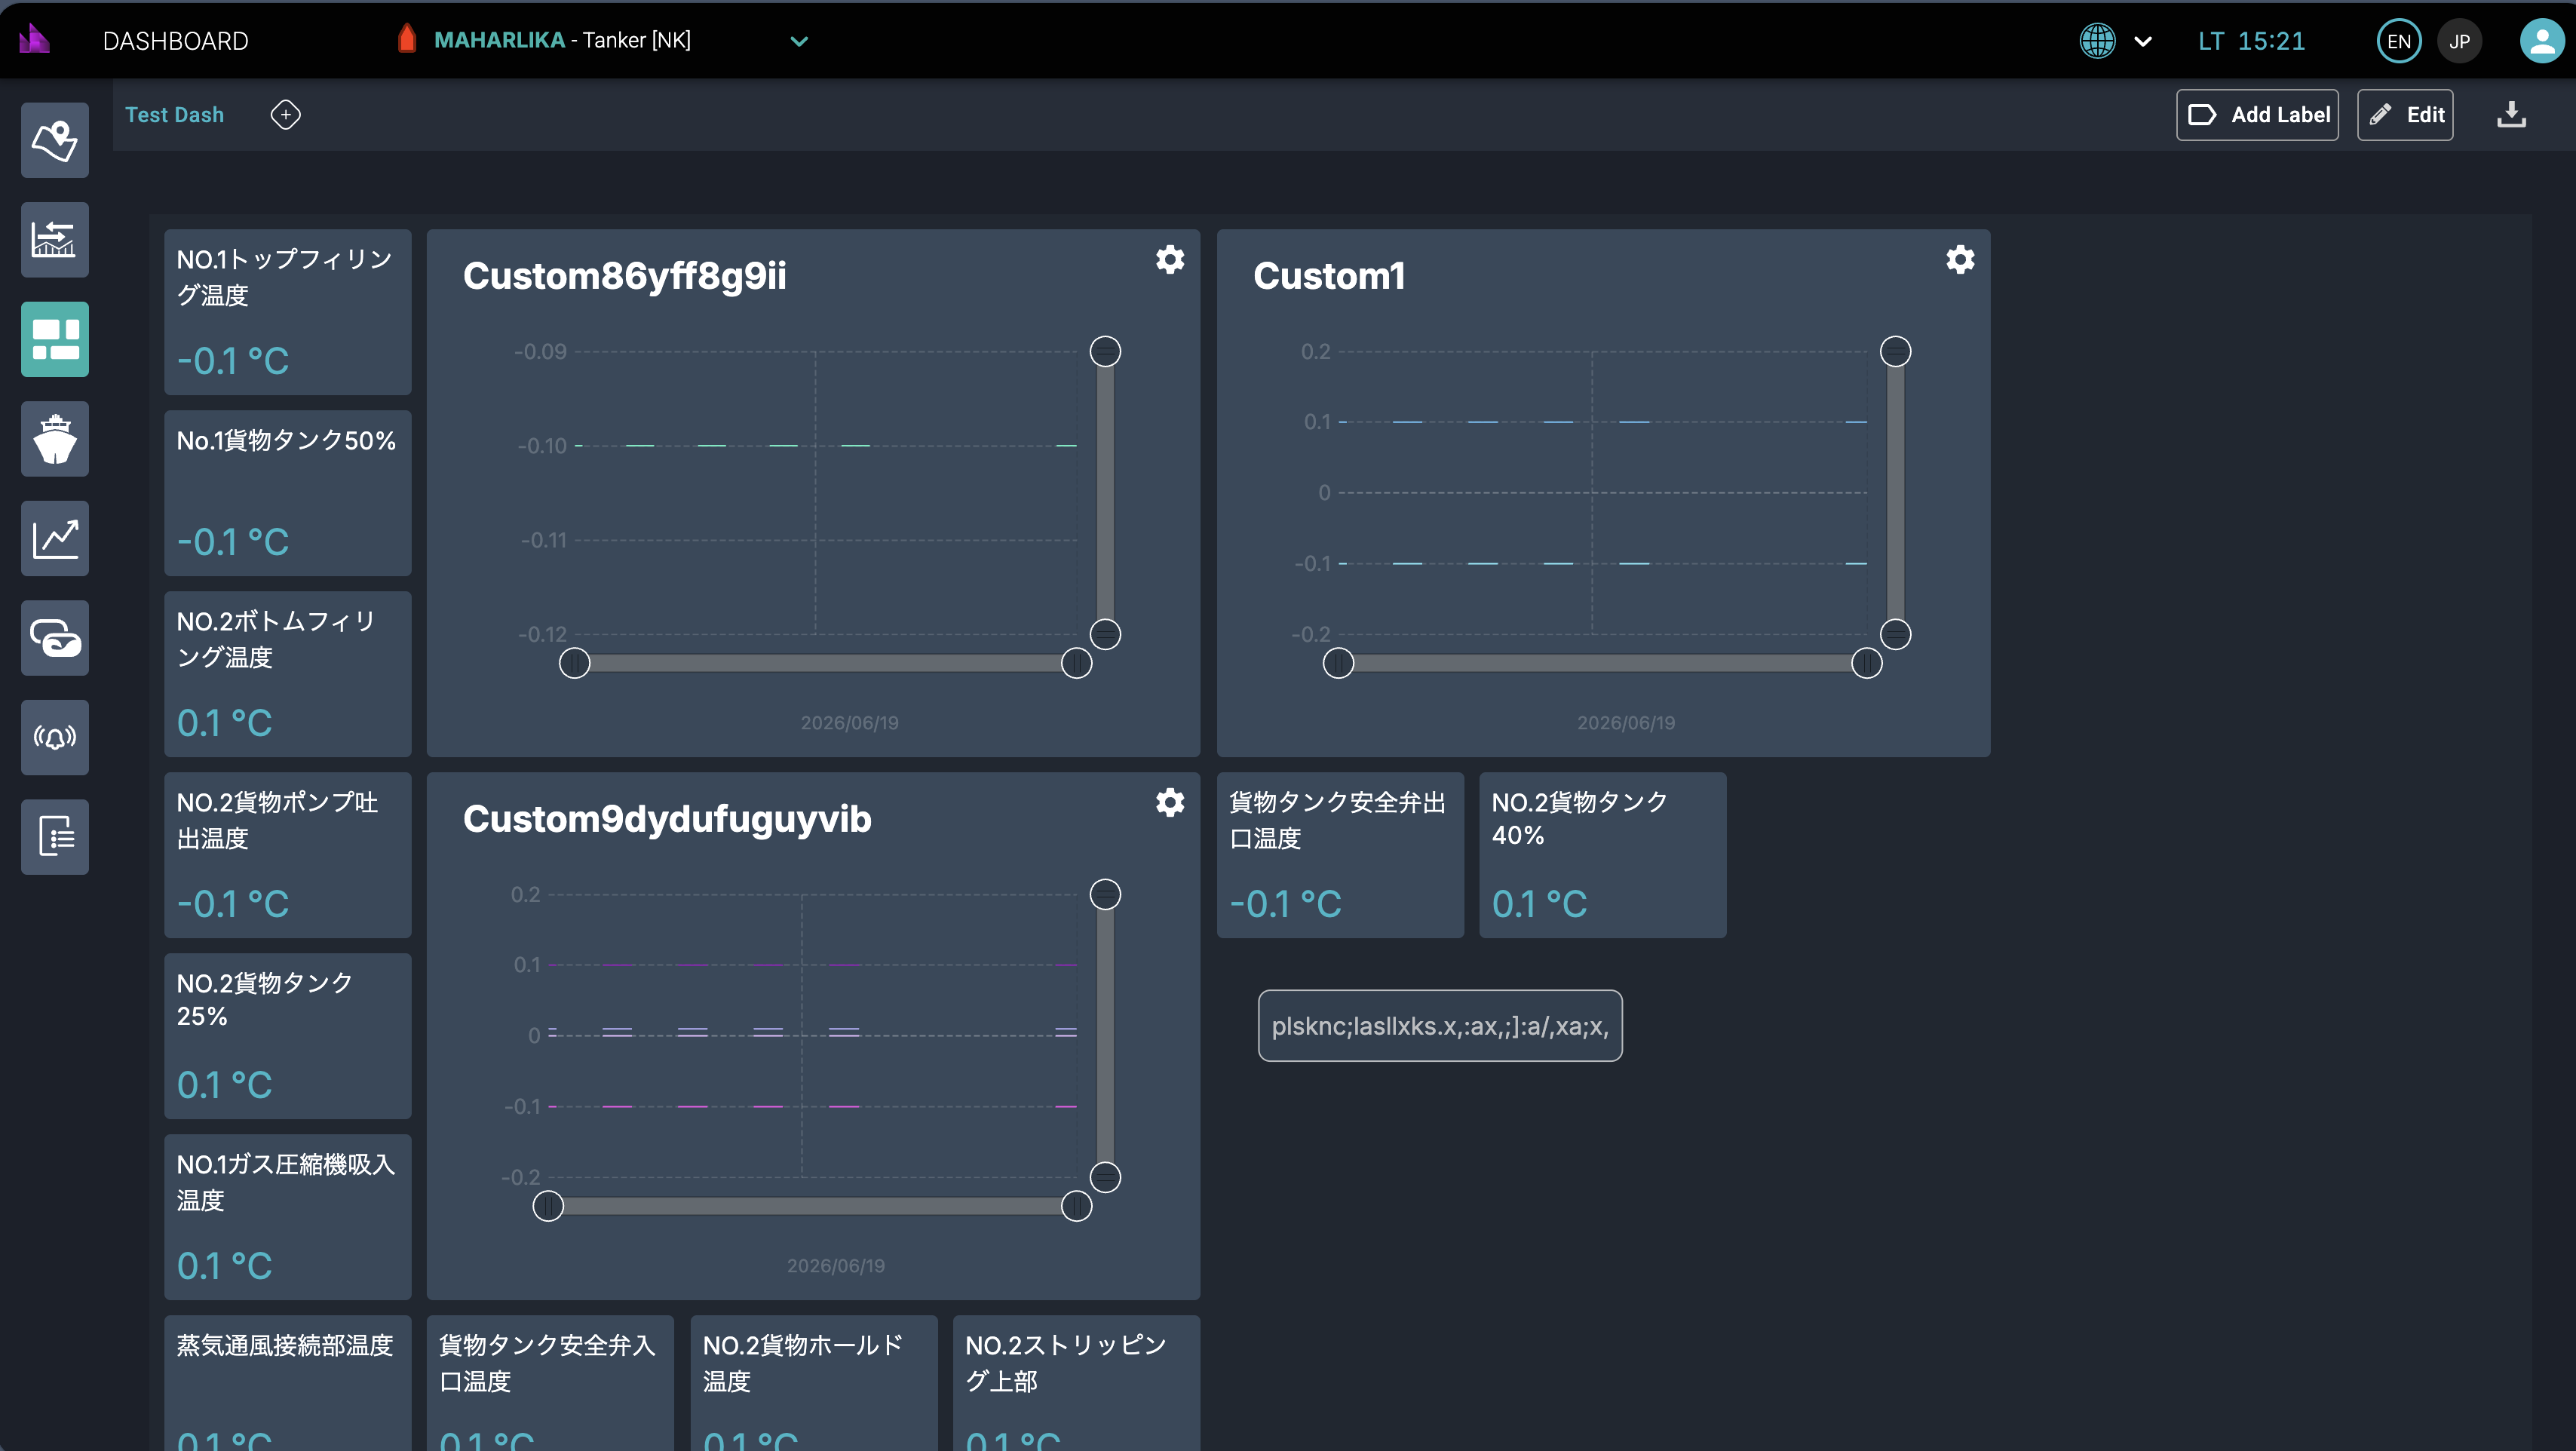
Rename / Edit dashboard: With the dashboard open, use the
Editbutton to change the name, description or layout.
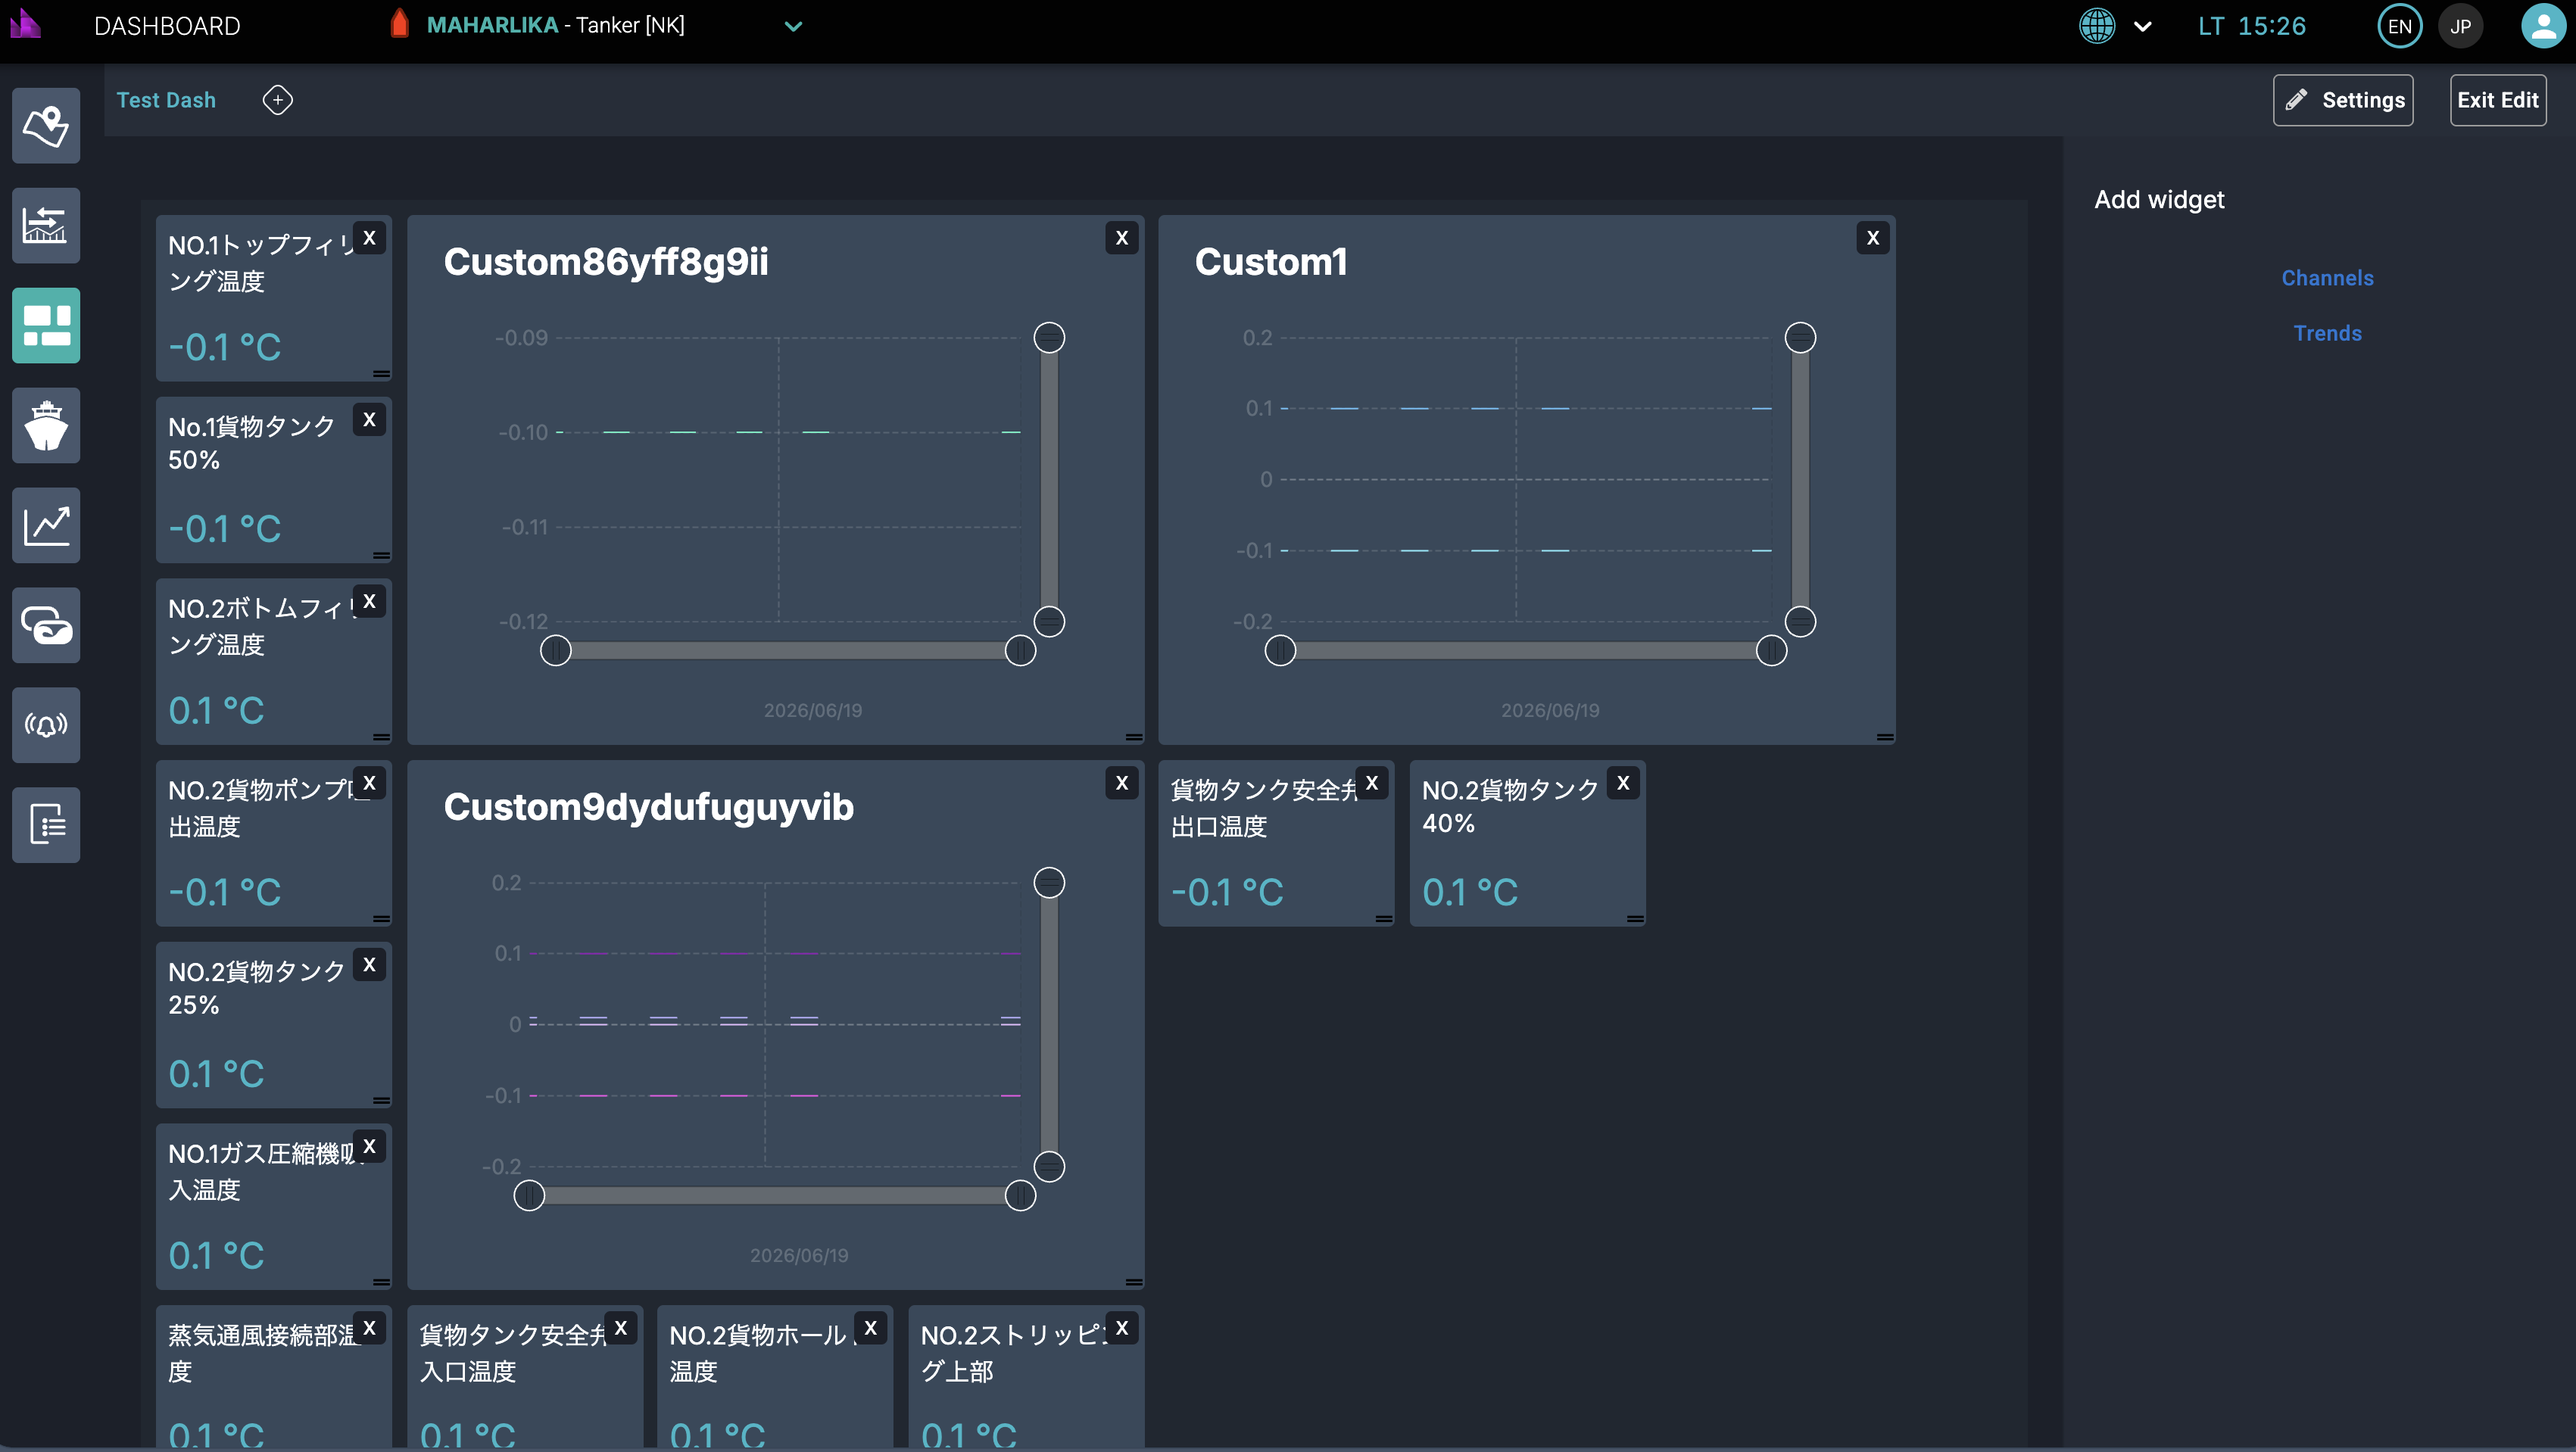
After changes are made Exit Edit should be clicked to save changes.
-
Delete dashboard: Only users with appropriate permissions will see
DELETE DASHBOARDbutton in dashboard settings.
Tips:
-
Use dashboard layouts and drag-and-drop to arrange charts and panels.
-
Use descriptive names for dashboards (e.g., "Engine Room — Live Overview").
Adding Charts to a Dashboard
-
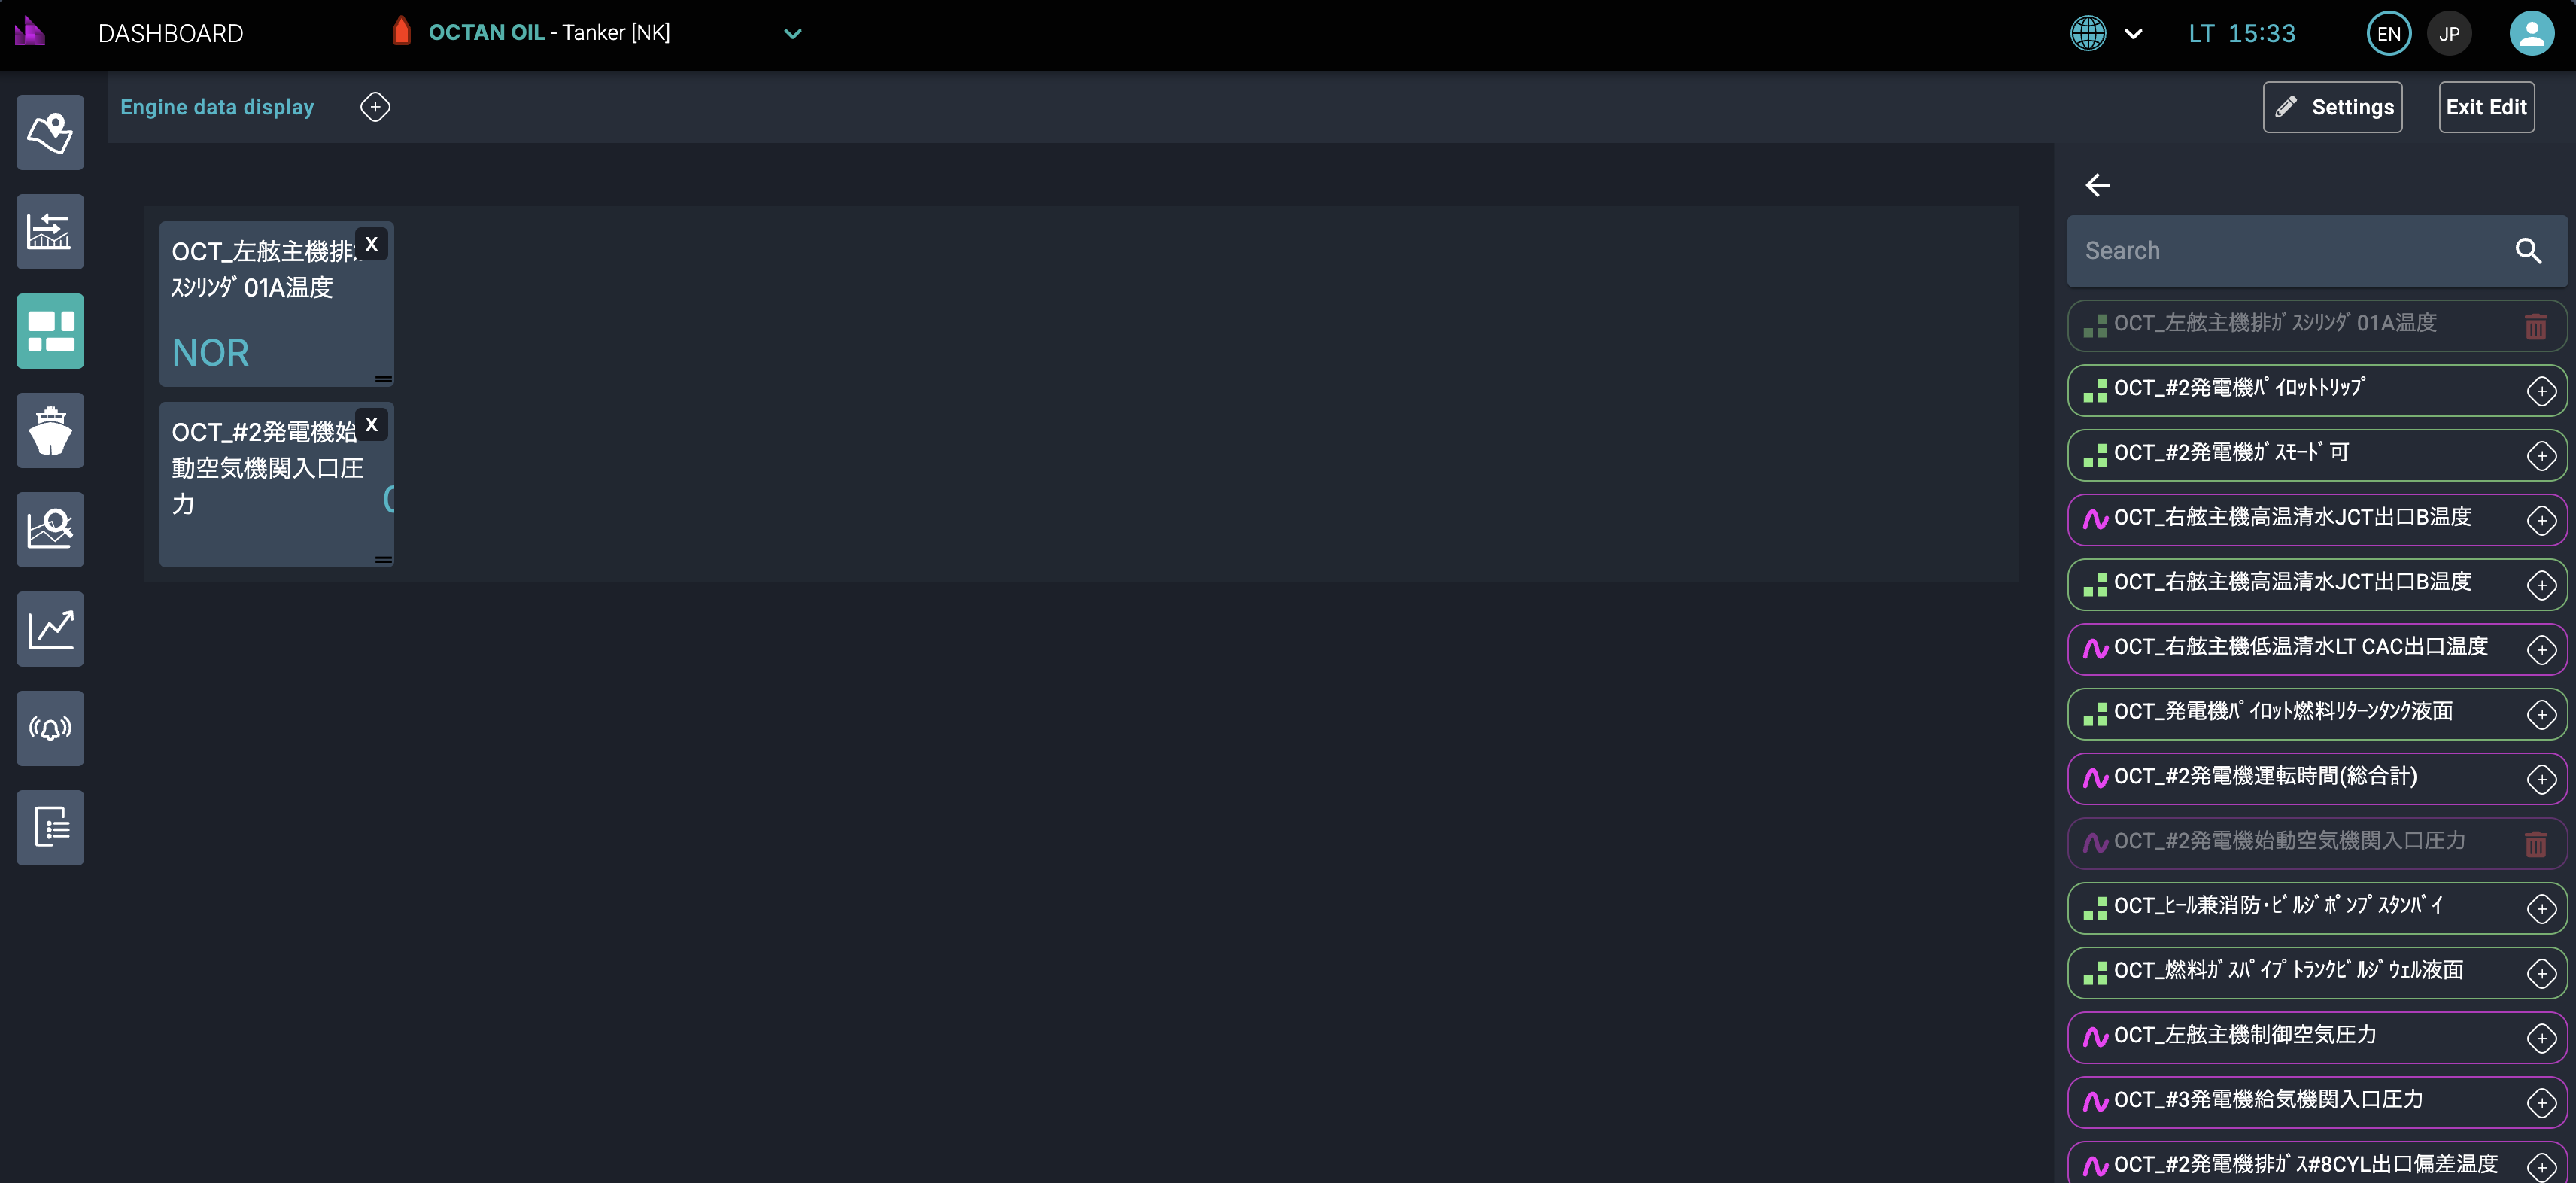
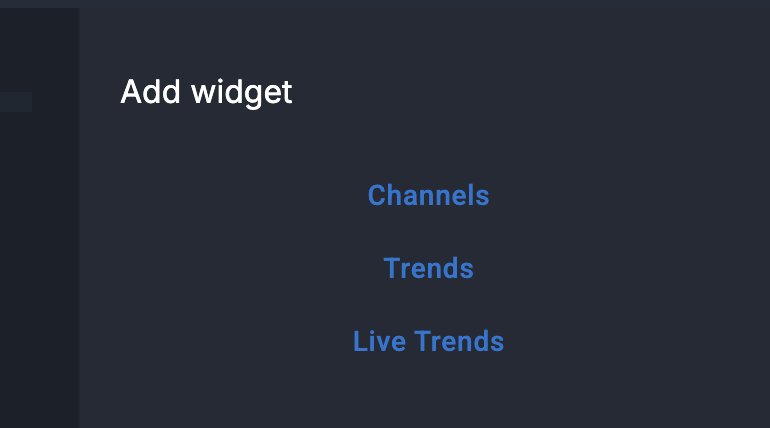
With a dashboard in Edit mode, click
ChannelsorTrends. -
Select the data source / channel(s): pick one or more channels from the channel selector. Channels correspond to sensor streams (e.g.,
engine.temperature,fuel.flow). Green channels are digital channels, pink channels are analog channels.
-
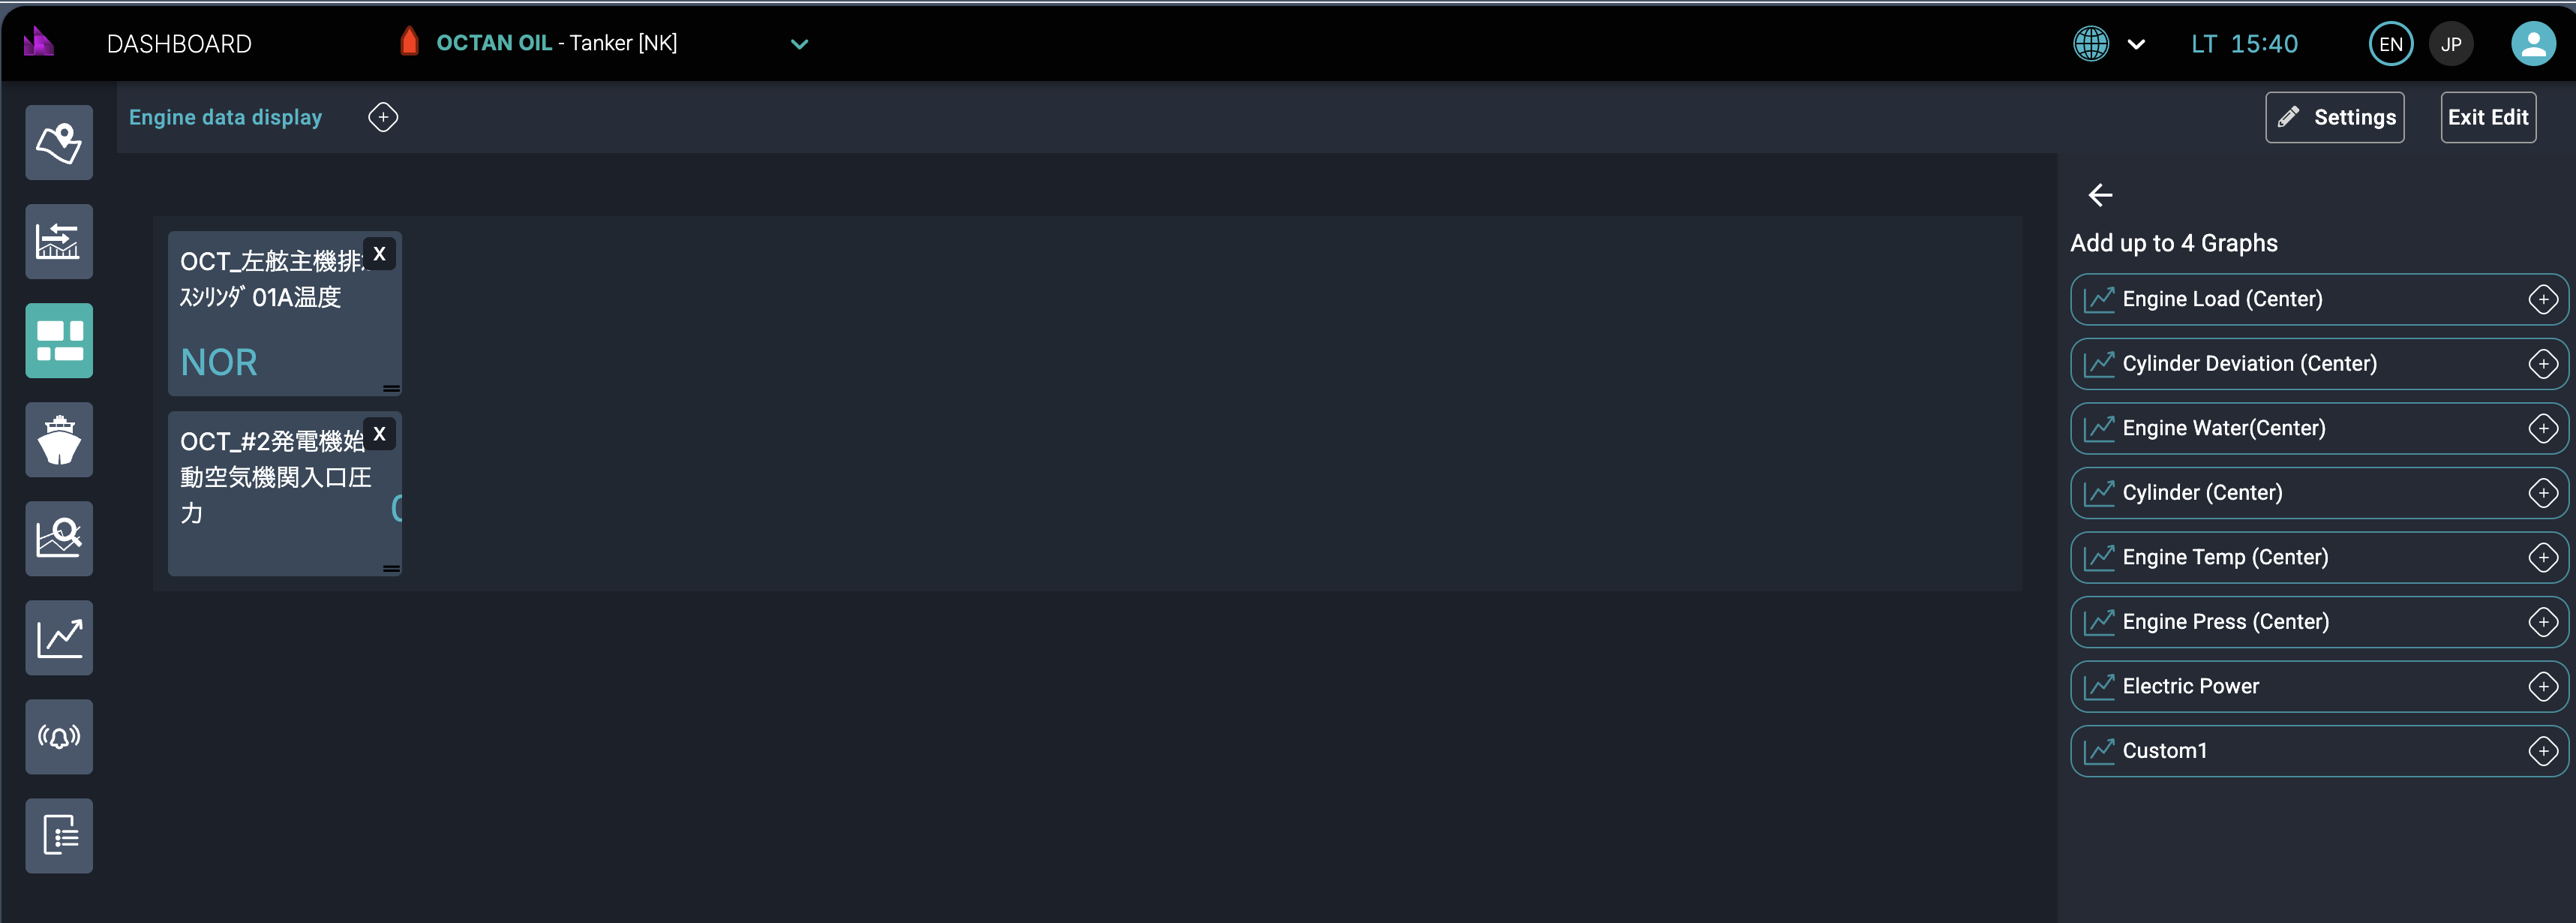
Click
Trendsto add up to 4 charts.
-
Use alt right corner of the chart to resize it by dragging right-left or up-down.
-
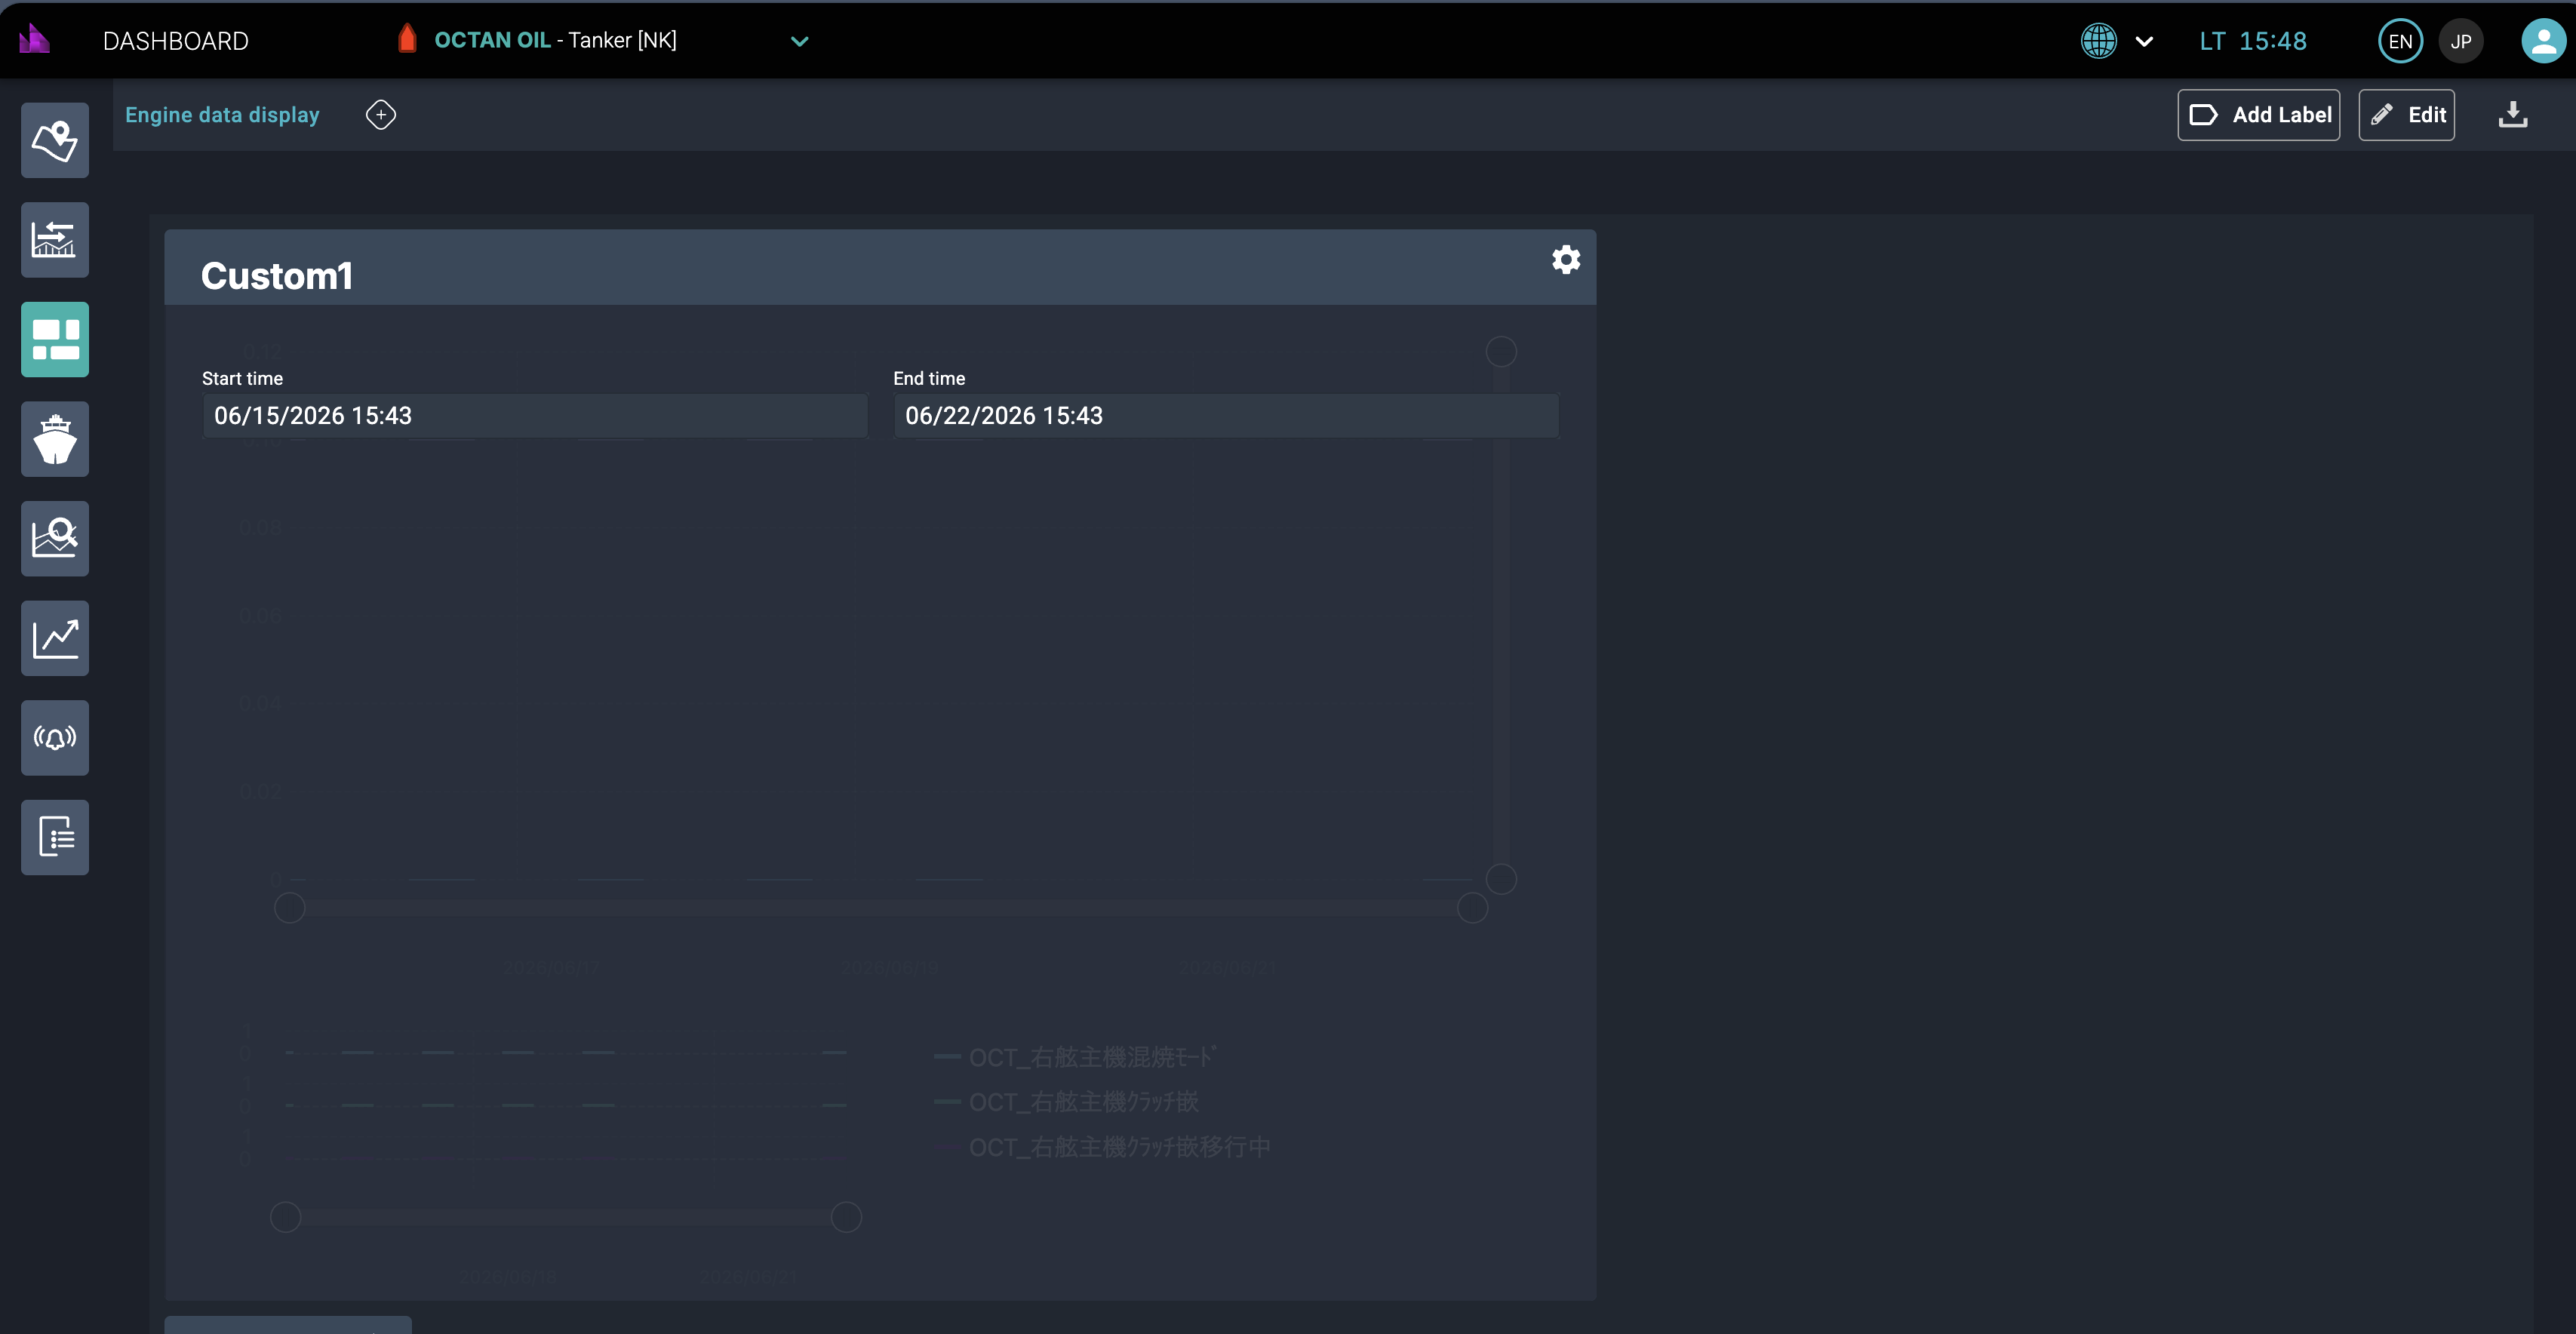
Click
 button to change start and end time of the chart. Default is 1 week.
-
Click again
button to save the change. -
Click
 button to download chart data.
 -
Click
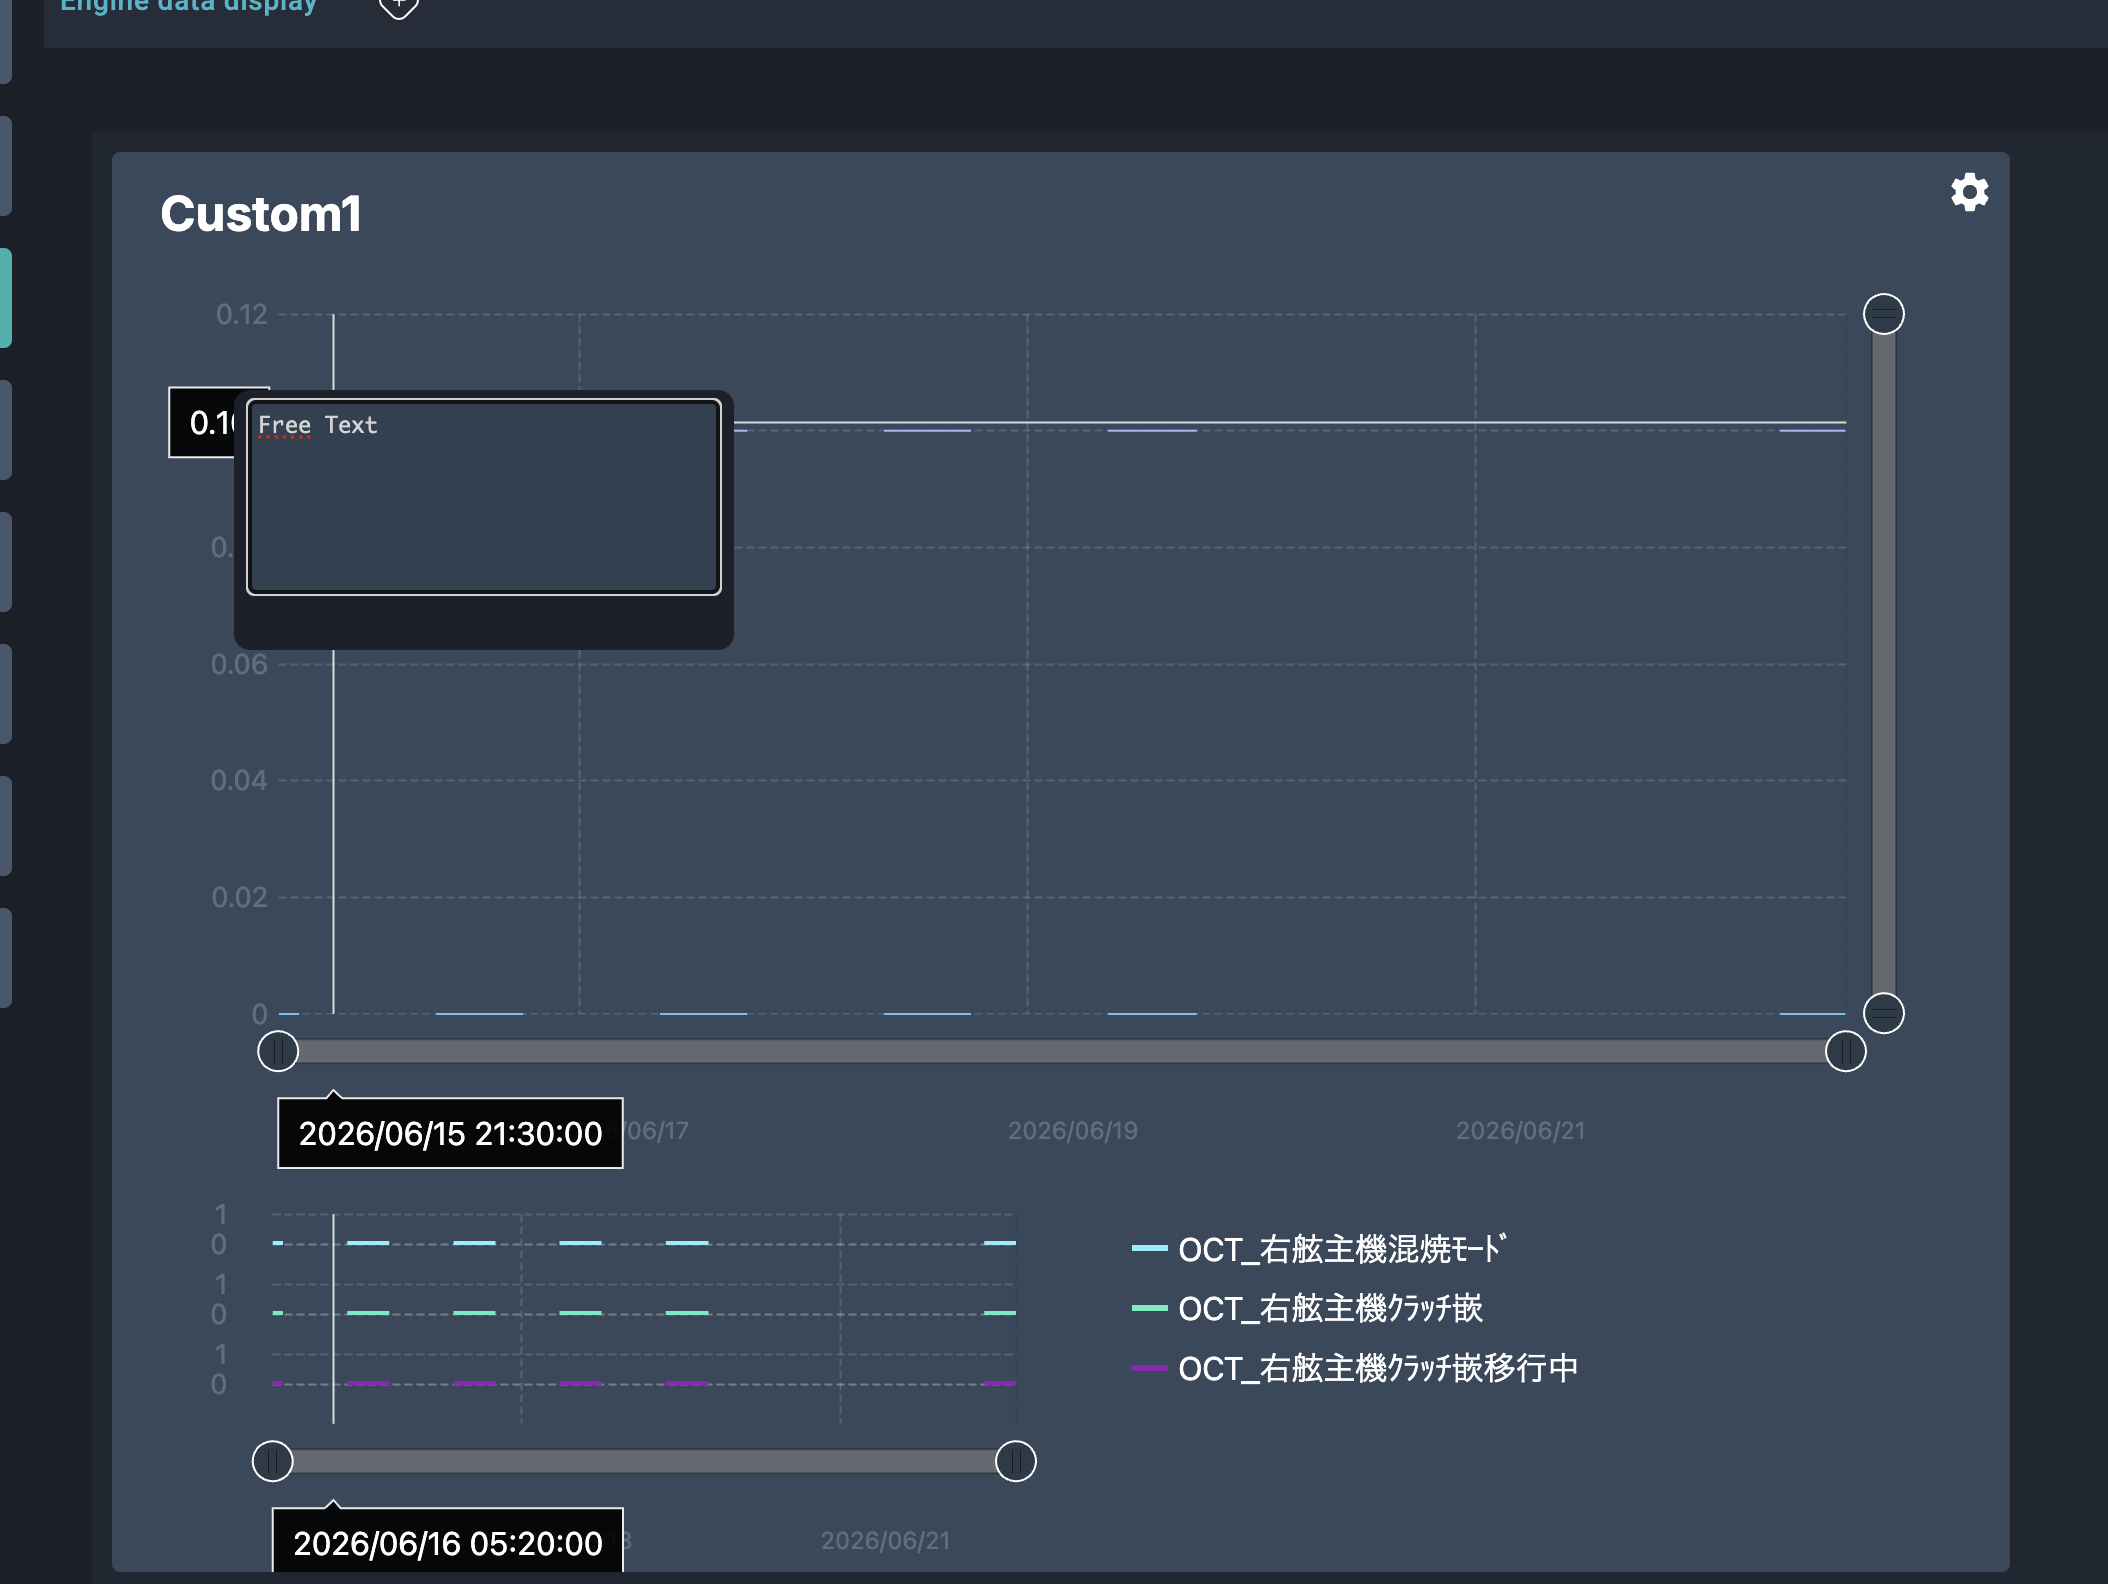
Add Labelbutton to add free text label on any place of the dashboard and then click any place on the dashboard.
-
Click enter to place the free text label.
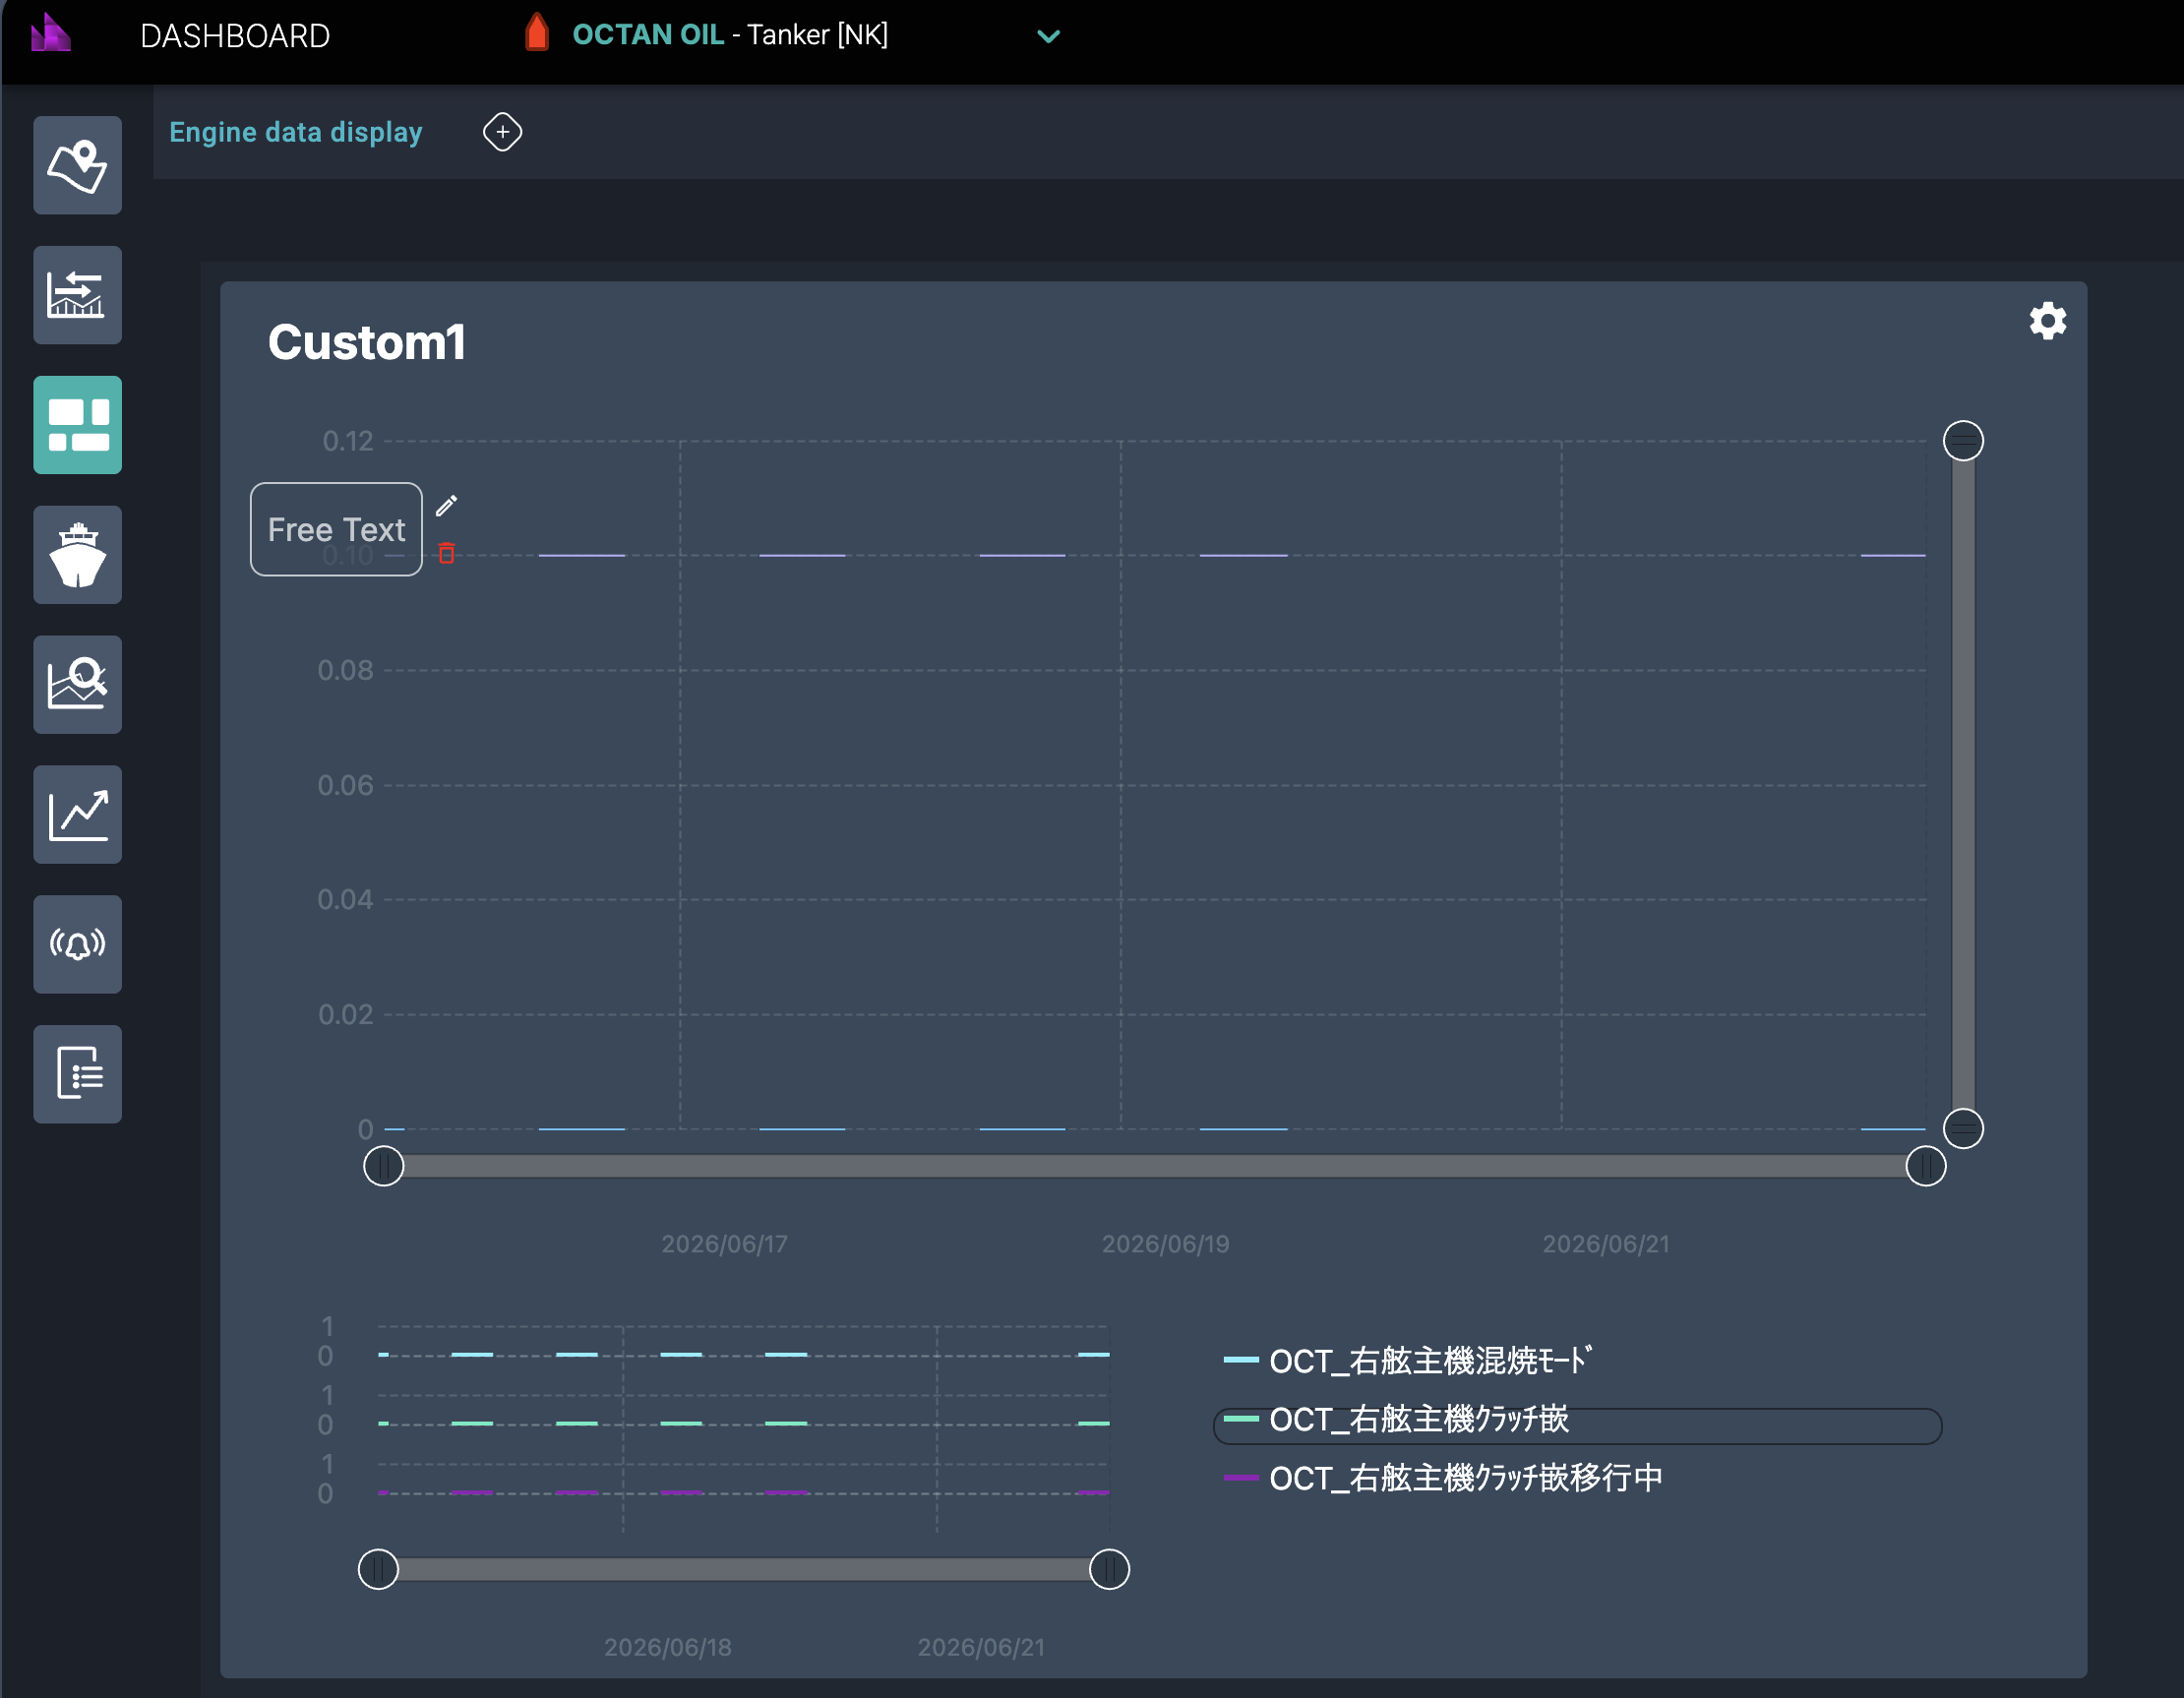
It is possible to edit or delete free text label by hovering mouse on it.
-
Click
Exit Editto save any change made on dashboard.
Quick checklist when configuring a chart: - Correct channel selected - Appropriate time window set
Live Trend Charts
Live trend charts show streaming data in real time. Live trend chart is a special feature that needs to be activated by JRCS Business. Please contact sales if you cannot see Live Trends button when you click Edit on any custom dashboard.
-
Open Live Trends: Click Live Trends from the left menu.
-
Start a live chart: Click
MAKE NEW LIVE CHARTfrom bottom of right panel menu. Select the channel(s) you want to track.
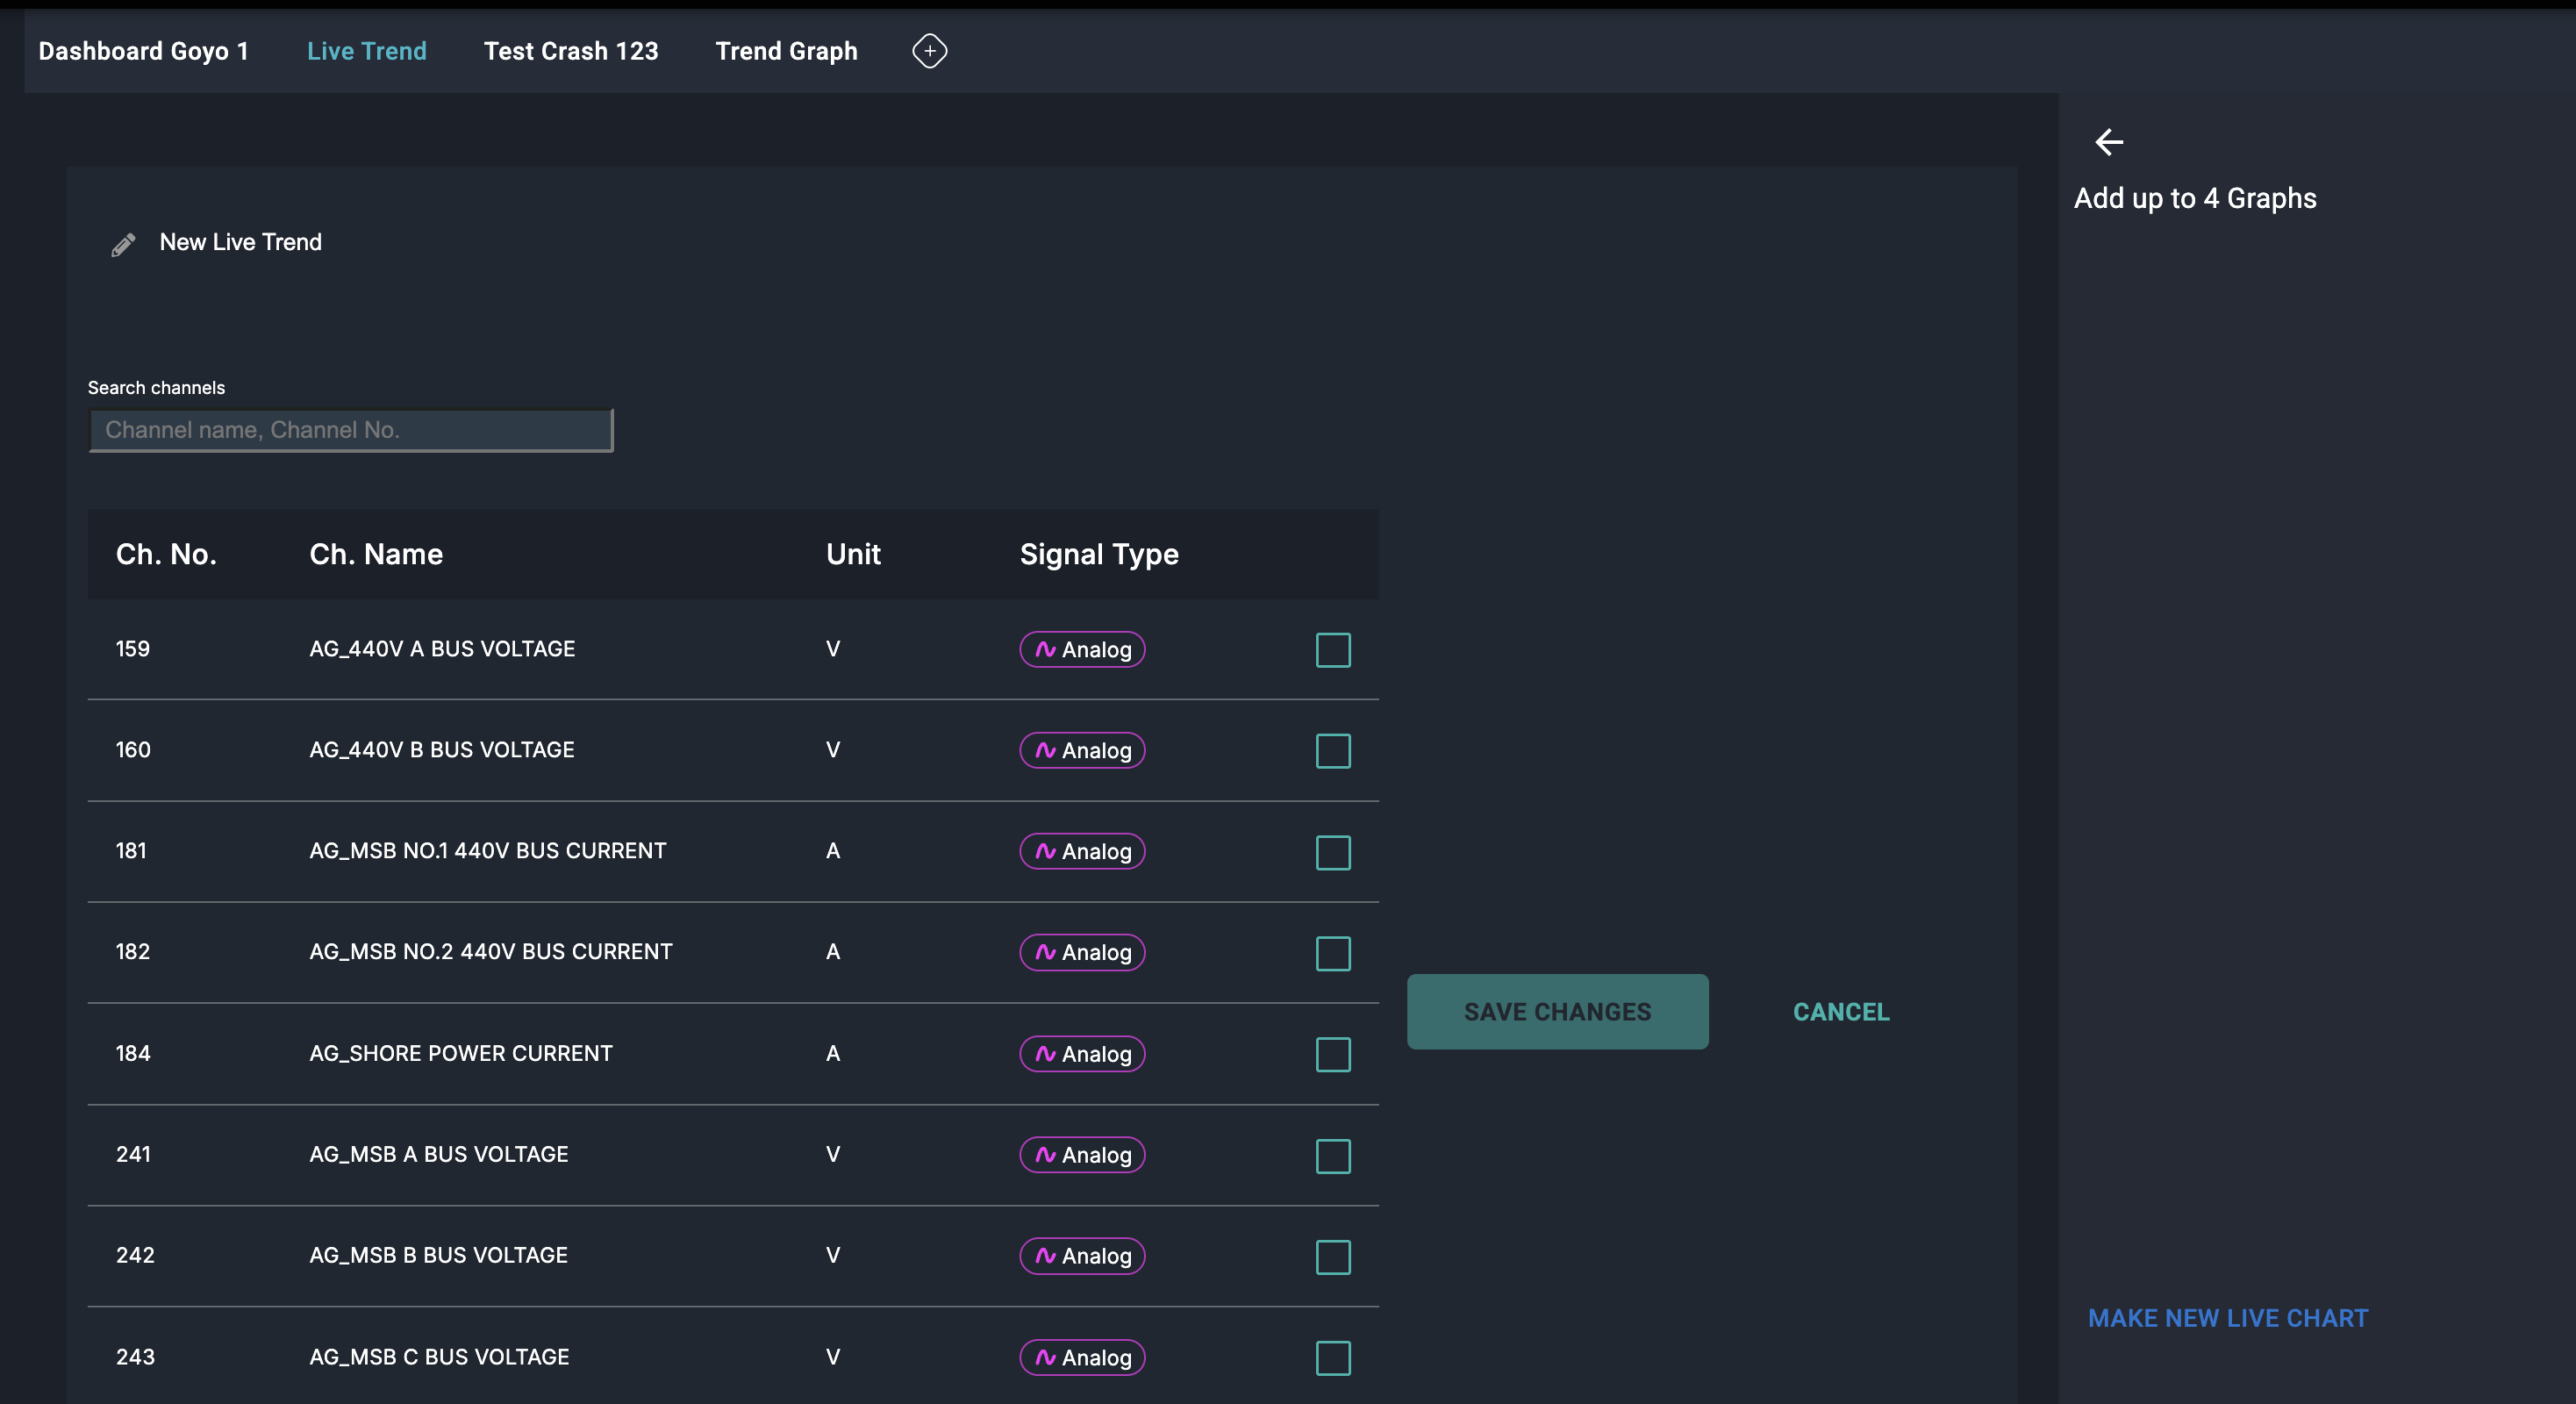
and click `SAVE CHANGES` and then `Exit Edit`. The live chart duration is set to 1 hour and updates every second.
-
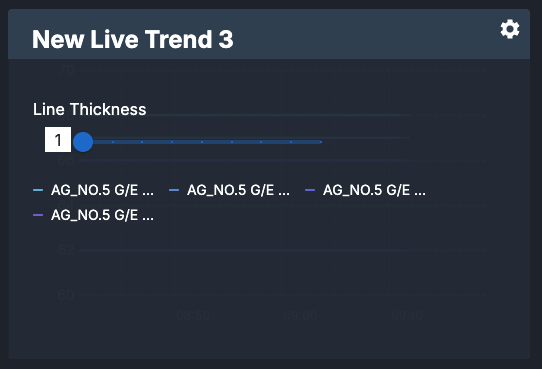
Configure line thickness: Click
button to choose the line thickness.
Best practices:
-
Limit charts with very high-frequency sampling to only necessary dashboards/users.
-
Combine related channels into a single chart to spot correlations.
Navigation Page
-
Purpose: Route and voyage-focused view for superintendents.
-
Components: Route planner overlay on the map, waypoints list, ETA/ETD indicators, live heading and course plots, and deviation-from-route alerts.
Monitoring Page
-
Purpose: Real-time operational view to watch vessel health.
-
Components: Main Engine Load, Main Engine Power Curve and generator power, load and runtime.
Trends Page
-
Purpose: Historical analysis and deeper trend visualization beyond live streaming.
-
Features: Multi-channel trend comparison, long-range time windows (days/weeks/month), horizontal and vertical scaling options, and the ability to save Trend views to dashboards.
Alarms Page
-
Purpose: Centralized view for active and historical alarms.
-
Features: Filter by severity, vessel, time, and status (active, acknowledged, cleared); see alarm history and root-cause links to channel trends: see alarm operations.
All Channels Page
-
Purpose: A comprehensive live display of all available telemetry channels of a vessel.
-
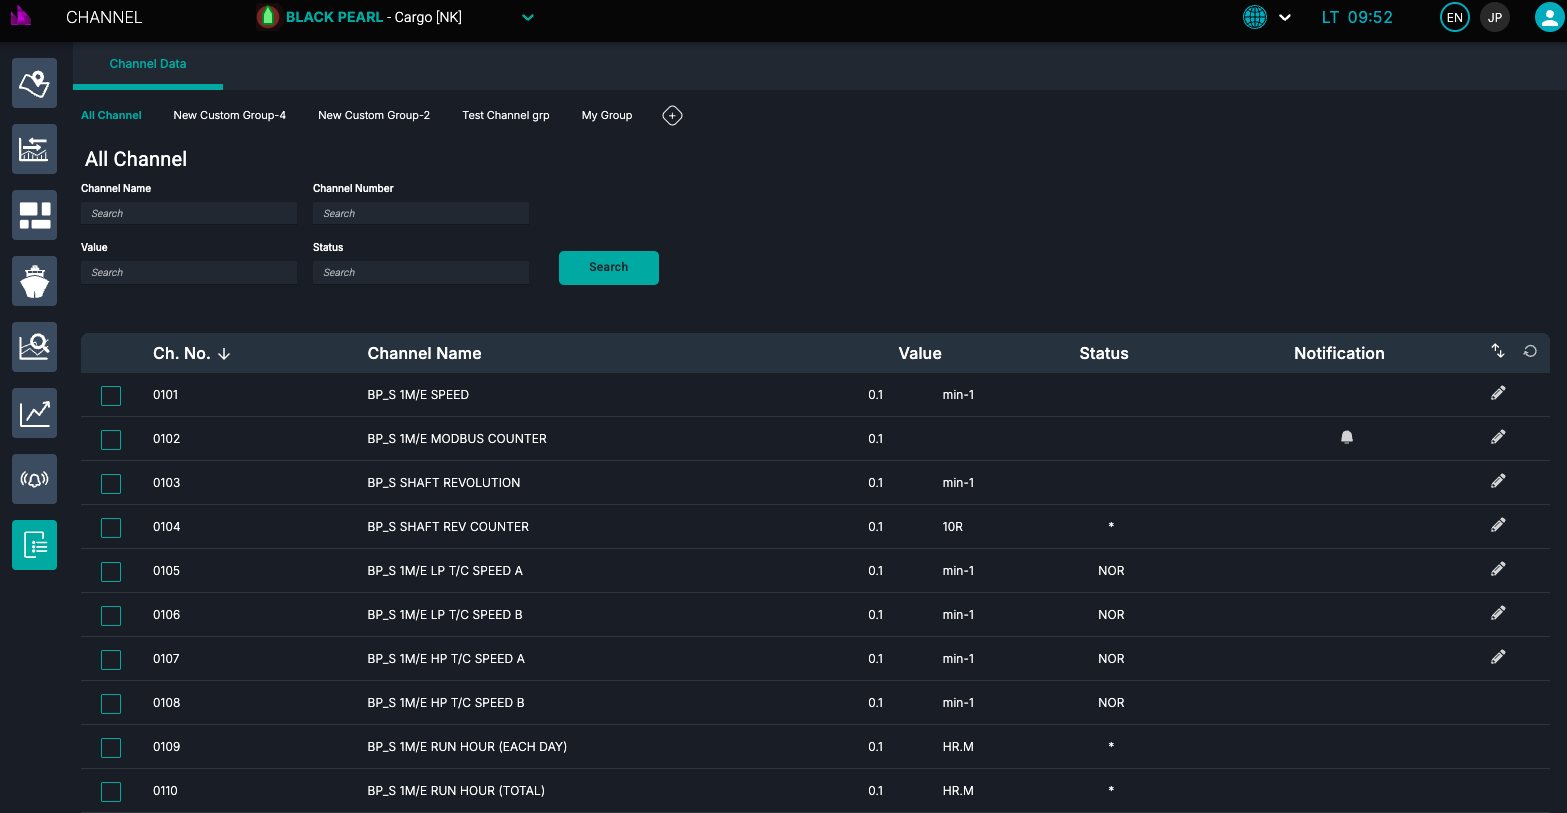
Features: Search, filter by channel name, channel number, Value, Status. Create custom channel groups. Create alerts for any channel.
-
click
 button to create alert for any channel. Add necessary threshold and email for notification.
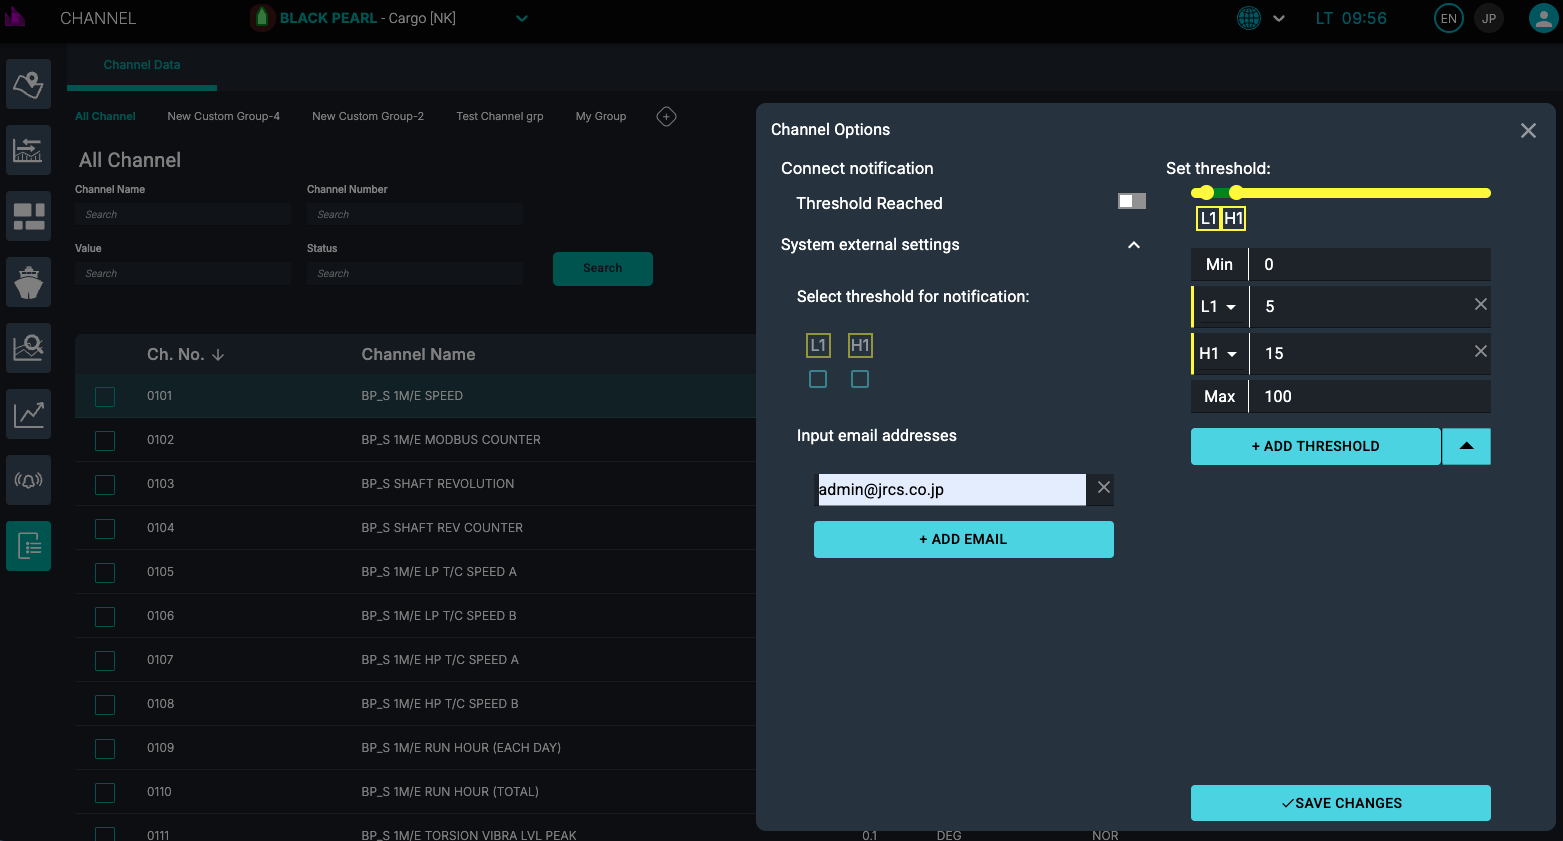
Alerts can be set only for analog channels.
Best practice: Start with conservative alerts to avoid noisy notifications, then tighten thresholds based on operational behavior.